Download presentation
Presentation is loading. Please wait.

1
Probability and the Binomial

2
What Does Probability Mean, and Where Do We Use It?
Cards. Weather. Other Examples? Definition (For use in this class). For a situation in which several different outcomes are possible, the probability for any specific outcome is defined as a fraction or proportion of all the possible outcomes. Probability of A. p(A) = (number of outcomes classified as A)/(total number of possible outcomes).
. For a situation in which several different outcomes are possible, the probability for any specific outcome is defined as a fraction or proportion of all the possible outcomes. Probability of A. p(A) = (number of outcomes classified as A)/(total number of possible outcomes).")
3
Tossing a Coin What are the possibilities?
Heads Tails What is the probability of tossing a head? There is one head There were two possibilities Therefore, one in two

4
What Is The Range of Probabilities?
0 – 1 What does a probability of zero mean? What does a probability of one mean?

5
Are We In This Class To Become Better Poker Players?
No, then why do I care about probability? We use concepts from probability to determine the likelihood of choosing certain scores, or groups of scores (samples), from a population distribution
, from a population distribution.")
6
A Simple Demonstration
We have a set of scores {1,1,2,3,3,4,4,4,5,6} What is the probability that we choose a number greater than 4? p(X>4)= 2/10 = .20 = 20% If you are unsure of this math, please review appendix a
= 2/10 = .20 = 20% If you are unsure of this math, please review appendix a.")
8
What Happens When We Have More Scores?
In the previous example we had n = 10 What happens to the distribution when n = a very large number? The distribution becomes a smooth curve Most of the time the distribution becomes normal

9
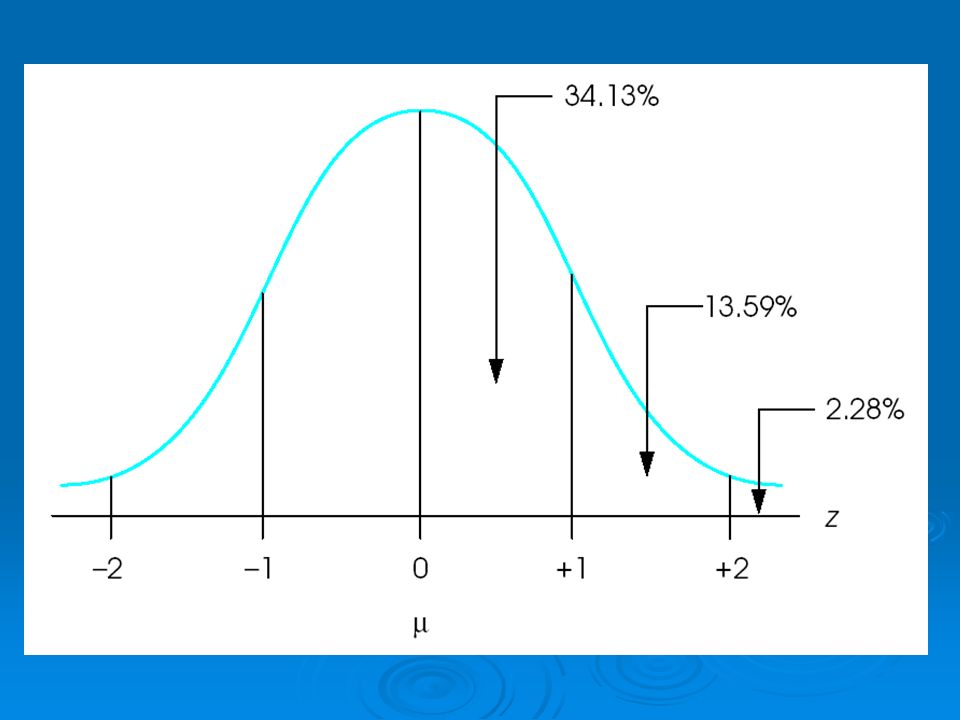
Once Again Ladies and Gentleman: The Normal Distribution

10
How Can We Look at Score Probabilities Based on The Normal Distribution?
First we must convert raw scores into z-scores From here, based on the normal curve, we can use a chart to determine probabilities

12
What Is the Unit Normal Table?
It is a table that gives us proportions of scores in a normal distribution based on z-scores

14
What Are Some Relationships We Notice From the Chart?
B + C = 1.00 D + C = 0.50

15
Lets Try A Few Examples

16
What Is Special About z = 1.96?

17
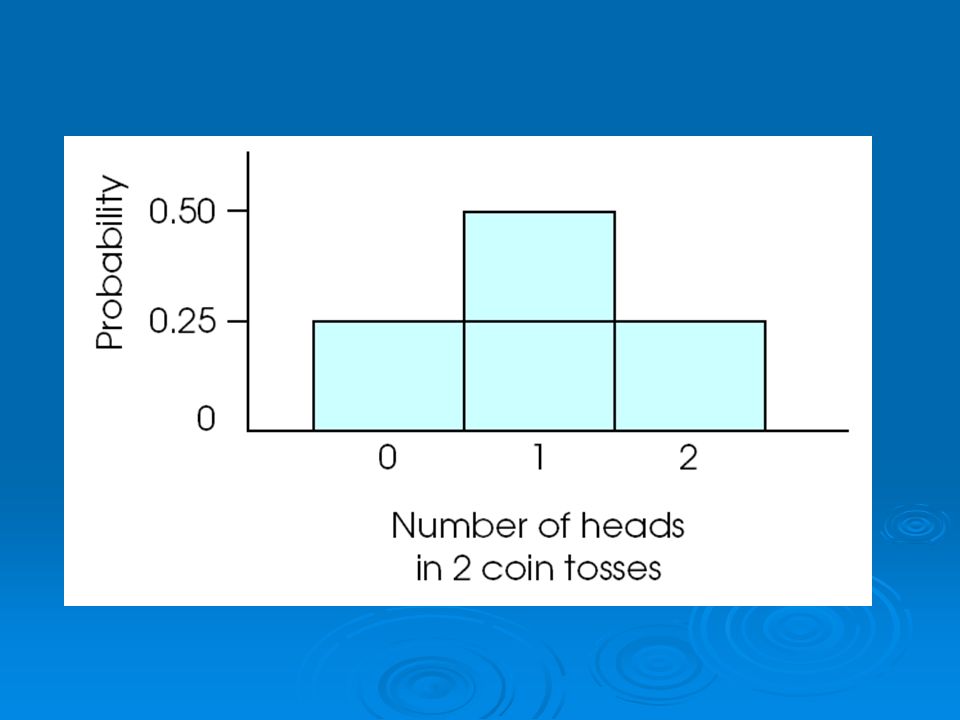
What Is The Binomial Distribution?
The Binomial distribution is used when two categories exist naturally in the data For example, heads or tails on a coin In the case of heads and tails: p(heads) = p(tails) = ½ We will usually have questions such as: What is the probability of obtaining 15 heads in 20 tosses of a fair coin? The normal distribution does an excellent job of answering these questions
 = p(tails) = ½. We will usually have questions such as: What is the probability of obtaining 15 heads in 20 tosses of a fair coin The normal distribution does an excellent job of answering these questions.")
18
Notation and Assumptions
Two categories, A and B p = p(A) = the probability of A q = p(B) = the probability of B The variable X refers to the number of times category A occurs in the sample
 = the probability of A. q = p(B) = the probability of B. The variable X refers to the number of times category A occurs in the sample.")
19
More About the Binomial Distribution
Therefore, the binomial distribution shows the probability associated with each value of X from X = 0 to X = n. What does X = 0 mean? There are no instances of A in the sample (therefore it is all B) What does X = n mean? There are ONLY A’s in our sample, and therefore no B’s
 What does X = n mean There are ONLY A’s in our sample, and therefore no B’s.")
23
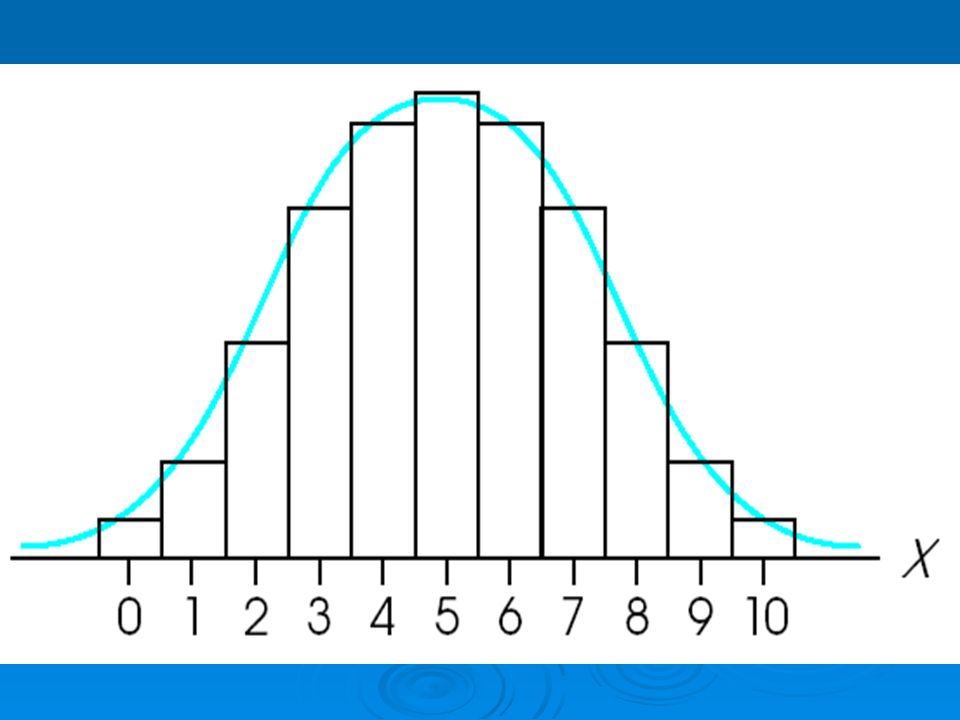
The Binomial Is Eventually Approximately Normal
When pn and qn are both equal to or greater than 10 When this happens: Mean: μ = pn Standard deviation: σ = √(npq) We find z-scores by: z = (X – pn) / √(npq) Remember z = (X – μ) / σ
 We find z-scores by: z = (X – pn) / √(npq) Remember z = (X – μ) / σ.")
Similar presentations


. µ x = x i P.>")

>")


>")
