Download presentation
Presentation is loading. Please wait.

1
Mining the functional genomics data III Data integration: Gene Ontology, PPI, URLMAP Jaak Vilo vilo@egeen.ee Havana, Cuba, 21.11.2003

2
EPCLUST Expression data GENOMES sequence, function, annotation SPEXS discover patterns URLMAP provide links Components of Expression Profiler http://ep.ebi.ac.uk/ Expression data External data, tools pathways, function, etc. PATMATCH visualise patterns EP:GO GeneOntology EP:PPI Prot-Prot ia. SEQLOGO

3
Expression Profiler: EPCLUST DATASELECT/ FILTER FOLDER ANALYZE A CLUSTER URLMAP GeneOntology Pathways Databases SPEXS Other tools

4
URLMAP Given a cluster of genes - many web based tools and databases to consult/follow up. How to link to them? How to manage many links, many tools? Answer: Centralize that linking

5
URLMAP - no need to cut & paste KEGG: SRS/InterPro Generates all links/forms dynamically Maintain links in one place Handle renaming of gene ids by synonyms Allow domain-specific link pages

6
A Simple Metabolic Pathway Shoshanna Wodak, Jacques van Helden

7
Links for each item type Yeast S. cerevisiae gene ID-s (ORFname, SP id, SGD ID, …) Pattern collections, e.g. substrings to profile generation by SEQLOGO Keyword searches from web based search engines
 Pattern collections, e.g. substrings to profile generation by SEQLOGO Keyword searches from web based search engines.")
8
Management of links Hierarchies of link collections One can point to any (sub)hierarchy directly LINK = URL, title, form parameters modifications/code DB lookups for synonyms
hierarchy directly LINK = URL, title, form parameters modifications/code DB lookups for synonyms")
9
Screen scraping – doable with a little perl programming g1,g2,g356 g1 g2 g356 Report

10
Gene Ontology TM www.geneontology.org www.geneontology.org GO is a systematic effort for data annotation Three independent ontologies Molecular Function Biological Process Cellular component How to integrate that into analysis tools?

12
DAG Structure Annotate to any level within DAG mitosis S.c. NNF1 mitotic chromosome condensation S.c. BRN1, D.m. barren

13
Database object: gene or gene product GO term ID Reference publication or computational method Evidence supporting annotation GO Annotation: Data

14
IDA - Inferred from Direct Assay IMP - Inferred from Mutant Phenotype IGI - Inferred from Genetic Interaction IPI - Inferred from Physical Interaction IEP - Inferred from Expression Pattern GO Evidence Codes TAS - Traceable Author Statement NAS - Non-traceable Author Statement IC - Inferred by Curator ISS - Inferred from Sequence or structural Similarity IEA - Inferred from Electronic Annotation ND - Not Determined

15
IDA - Inferred from Direct Assay IMP - Inferred from Mutant Phenotype IGI - Inferred from Genetic Interaction IPI - Inferred from Physical Interaction IEP - Inferred from Expression Pattern GO Evidence Codes TAS - Traceable Author Statement NAS - Non-traceable Author Statement IC - Inferred by Curator ISS - Inferred from Sequence or structural Similarity IEA - Inferred from Electronic Annotation ND - Not Determined From reviews or introductions From primary literature automated

16
Example (GoMiner)
")
17
EP:GO tool for GeneOntology Browse Search by keywords; EC, term. etc.. Get associated genes Submit associated genes to URLMAP Annotate gene clusters using GO terms

18
URLMAP => Look up expression data EP:GO EPCLUST

19
Annotate Clusters (EP:GO) 1 23 4 5 6 A,D B,C E F,G,H J I F,G B,E B,A F,G,I B,E,F,I
 A,D B,C E F,G,H J I F,G B,E B,A F,G,I B,E,F,I")
20
Set overlap GO term CLUSTER A: |G C| / min( |G|, |C|) B: P( choose |C| from N with |G|, observe |G C|+) N genes G C
 B: P( choose |C| from N with |G|, observe |G C|+) N genes G C")
21
Annotation of clusters GO:0042254 Process: ribosome biogenesis and assembly (+2:15) (depth=7) [sgd:2:187] GO:0042254: 47 from cluster (size 98) vs 187 in this class (including subclasses) GO:0006364 Process: rRNA processing (+3:3) (depth=8) [sgd:50:126] GO:0006364: 35 from cluster (size 98) vs 126 in this class (including subclasses) GO:0006360 Process: transcription from Pol I promoter (+6:14) (depth=8) [sgd:23:155] GO:0006360: 38 from cluster (size 98) vs 155 in this class (including subclasses) GO:0005730 Component: nucleolus (+10:17) (depth=6) [sgd:154:210] GO:0005730: 45 from cluster (size 98) vs 210 in this class (including subclasses) GO:0030515 Function: snoRNA binding (depth=6) [sgd:23:23] GO:0030515: 17 from cluster (size 98) vs 23 in this class (including subclasses) GO:0030490 Process: processing of 20S pre-rRNA (depth=9) [sgd:33:33] GO:0030490: 18 from cluster (size 98) vs 33 in this class (including subclasses) GO:0005732 Component: small nucleolar ribonucleoprotein complex (depth=6) [sgd:30:30] GO:0005732: 16 from cluster (size 98) vs 30 in this class (including subclasses) GO:0006396 Process: RNA processing (+7:52) (depth=7) [sgd:7:370] GO:0006396: 40 from cluster (size 98) vs 370 in this class (including subclasses) GO:0042254UL2187 GO:0006364UL50126 GO:0006360UL23155 GO:0005730UL154210 GO:0030515UL23 GO:0030490UL33 GO:0005732UL30 GO:0006396UL7370 …
![Annotation of clusters GO: Process: ribosome biogenesis and assembly (+2:15) (depth=7) [sgd:2:187] GO: : 47 from cluster (size 98) vs 187 in this class (including subclasses) GO: Process: rRNA processing (+3:3) (depth=8) [sgd:50:126] GO: : 35 from cluster (size 98) vs 126 in this class (including subclasses) GO: Process: transcription from Pol I promoter (+6:14) (depth=8) [sgd:23:155] GO: : 38 from cluster (size 98) vs 155 in this class (including subclasses) GO: Component: nucleolus (+10:17) (depth=6) [sgd:154:210] GO: : 45 from cluster (size 98) vs 210 in this class (including subclasses) GO: Function: snoRNA binding (depth=6) [sgd:23:23] GO: : 17 from cluster (size 98) vs 23 in this class (including subclasses) GO: Process: processing of 20S pre-rRNA (depth=9) [sgd:33:33] GO: : 18 from cluster (size 98) vs 33 in this class (including subclasses) GO: Component: small nucleolar ribonucleoprotein complex (depth=6) [sgd:30:30] GO: : 16 from cluster (size 98) vs 30 in this class (including subclasses) GO: Process: RNA processing (+7:52) (depth=7) [sgd:7:370] GO: : 40 from cluster (size 98) vs 370 in this class (including subclasses) GO: UL2187 GO: UL50126 GO: UL23155 GO: UL GO: UL23 GO: UL33 GO: UL30 GO: UL7370 …](http://images.slideplayer.com/1/217467/slides/slide_21.jpg "Annotation of clusters GO: Process: ribosome biogenesis and assembly (+2:15) (depth=7) [sgd:2:187] GO: : 47 from cluster (size 98) vs 187 in this class (including subclasses) GO: Process: rRNA processing (+3:3) (depth=8) [sgd:50:126] GO: : 35 from cluster (size 98) vs 126 in this class (including subclasses) GO: Process: transcription from Pol I promoter (+6:14) (depth=8) [sgd:23:155] GO: : 38 from cluster (size 98) vs 155 in this class (including subclasses) GO: Component: nucleolus (+10:17) (depth=6) [sgd:154:210] GO: : 45 from cluster (size 98) vs 210 in this class (including subclasses) GO: Function: snoRNA binding (depth=6) [sgd:23:23] GO: : 17 from cluster (size 98) vs 23 in this class (including subclasses) GO: Process: processing of 20S pre-rRNA (depth=9) [sgd:33:33] GO: : 18 from cluster (size 98) vs 33 in this class (including subclasses) GO: Component: small nucleolar ribonucleoprotein complex (depth=6) [sgd:30:30] GO: : 16 from cluster (size 98) vs 30 in this class (including subclasses) GO: Process: RNA processing (+7:52) (depth=7) [sgd:7:370] GO: : 40 from cluster (size 98) vs 370 in this class (including subclasses) GO: UL2187 GO: UL50126 GO: UL23155 GO: UL GO: UL23 GO: UL33 GO: UL30 GO: UL7370 …")
22
>YAL036C chromo=1 coord=(76154-75048(C)) start=-600 end=+2 seq=(76152-76754) TGTTCTTTCTTCTTCTGCTTCTCCTTTTCCTTTTTTTCCTTCTCCTTTTCCTTCTTGGACTTTAGTATAGGCTTACCATCCTTCTTCTCTTCAATAACCTTCTTTTCTTG CTTCTTCTTCGATTGCTTCAAAGTAGACATGAAGTCGCCTTCAATGGCCTCAGCACCTTCAGCACTTGCACTTGCTTCTCTGGAAGTGTCATCTGCACCTGCGCTGCTTT CTGGATTTGGAGTTGGCGTGGCACTGATTTCTTCGTTCTGGGCGGCGTCTTCTTCGAATTCCTCATCCCAGTAGTTCTGTTGGTTCTTTTTACTCTTTTTCGCCATCTTT CACTTATCTGATGTTCCTGATTGCCCTTCTTATCCCCTCAAAGTTCACCTTTGCCACTTATTCTAGTGCAAGATCTCTTGCTTTCAATGGGCTTAAAGCTTGAAAAATTT TTTCACATCACAAGCGACGAGGGCCCGTTTTTTTCATCGATGAGCTATAAGAGTTTTCCACTTTTAAGATGGGATATTACGGTGTGATGAGGGCGCAATGATAGGAAGTG TTTGAAGCTAGATGCAGTAGGTGCAAGCGTAGAGTTGTTGATTGAGCAAA_ATG_ >YAL025C chromo=1 coord=(101147-100230(C)) start=-600 end=+2 seq=(101145-101747) CTTAGAAGATAAAGTAGTGAATTACAATAAATTCGATACGAACGTTCAAATAGTCAAGAATTTCATTCAAAGGGTTCAATGGTCCAAGTTTTACACTTTCAAAGTTAACC ACGAATTGCTGAGTAAGTGTGTTTATATTAGCACATTAACACAAGAAGAGATTAATGAACTATCCACATGAGGTATTGTGCCACTTTCCTCCAGTTCCCAAATTCCTCTT GTAAAAAACTTTGCATATAAAATATACAGATGGAGCATATATAGATGGAGCATACATACATGTTTTTTTTTTTTTAAAAACATGGACTCGAACAGAATAAAAGAATTTAT AATGATAGATAATGCATACTTCAATAAGAGAGAATACTTGTTTTTAAATGAGAATTGCTTTCATTAGCTCATTATGTTCAGATTATCAAAATGCAGTAGGGTAATAAACC TTTTTTTTTTTTTTTTTTTTTTTTGAAAAATTTTCCGATGAGCTTTTGAAAAAAAATGAAAAAGTGATTGGTATAGAGGCAGATATTGCATTGCTTAGTTCTTTCTTTTG ACAGTGTTCTCTTCAGTACATAACTACAACGGTTAGAATACAACGAGGAT_ATG_... >YBR084W chromo=2 coord=(411012-413936) start=-600 end=+2 seq=(410412-411014) CCATGTATCCAAGACCTGCTGAAGATGCTTACAATGCCAATTATATTCAAGGTCTGCCCCAGTACCAAACATCTTATTTTTCGCAGCTGTTATTATCATCACCCCAGCAT TACGAACATTCTCCACATCAAAGGAACTTTACGCCATCCAACCAATCGCATGGGAACTTTTATTAAATGTCTACATACATACATACATCTCGTACATAAATACGCATACG TATCTTCGTAGTAAGAACCGTCACAGATATGATTGAGCACGGTACAATTATGTATTAGTCAAACATTACCAGTTCTCGAACAAAACCAAAGCTACTCCTGCAACACTCTT CTATCGCACATGTATGGTTCTTATTGTTTCCCGAGTTCTTTTTTACTGACGCGCCAGAACGAGTAAGAAAGTTCTCTAGCGCCATGCTGAAATTTTTTTCACTTCAACGG ACAGCGATTTTTTTTCTTTTTCCTCCGAAATAATGTTGCAGCGGTTCTCGATGCCTCAAGAATTGCAGAAGTAAACCAGCCAATACACATCAAAAAACAACTTTCATTAC TGTGATTCTCTCAGTCTGTTCATTTGTCAGATATTTAAGGCTAAAAGGAA_ATG_ 101 Sequences relative to ORF start GATGAG.T 1:52/70 2:453/508 R:7.52345 BP:1.02391e-33 G.GATGAG.T 1:39/49 2:193/222 R:13.244 BP:2.49026e-33 AAAATTTT 1:63/77 2:833/911 R:4.95687 BP:5.02807e-32 TGAAAA.TTT 1:45/53 2:333/350 R:8.85687 BP:1.69905e-31 TG.AAA.TTT 1:53/61 2:538/570 R:6.45662 BP:3.24836e-31 TG.AAA.TTTT 1:40/43 2:254/260 R:10.3214 BP:3.84624e-30 TGAAA..TTT 1:54/65 2:608/645 R:5.82106 BP:1.0887e-29... GATGAG.T TGAAA..TTT YGR128C + 100
 start=-600 end=+2 seq=( ) CCATGTATCCAAGACCTGCTGAAGATGCTTACAATGCCAATTATATTCAAGGTCTGCCCCAGTACCAAACATCTTATTTTTCGCAGCTGTTATTATCATCACCCCAGCAT TACGAACATTCTCCACATCAAAGGAACTTTACGCCATCCAACCAATCGCATGGGAACTTTTATTAAATGTCTACATACATACATACATCTCGTACATAAATACGCATACG TATCTTCGTAGTAAGAACCGTCACAGATATGATTGAGCACGGTACAATTATGTATTAGTCAAACATTACCAGTTCTCGAACAAAACCAAAGCTACTCCTGCAACACTCTT CTATCGCACATGTATGGTTCTTATTGTTTCCCGAGTTCTTTTTTACTGACGCGCCAGAACGAGTAAGAAAGTTCTCTAGCGCCATGCTGAAATTTTTTTCACTTCAACGG ACAGCGATTTTTTTTCTTTTTCCTCCGAAATAATGTTGCAGCGGTTCTCGATGCCTCAAGAATTGCAGAAGTAAACCAGCCAATACACATCAAAAAACAACTTTCATTAC TGTGATTCTCTCAGTCTGTTCATTTGTCAGATATTTAAGGCTAAAAGGAA_ATG_ 101 Sequences relative to ORF start GATGAG.T 1:52/70 2:453/508 R: BP: e-33 G.GATGAG.T 1:39/49 2:193/222 R: BP: e-33 AAAATTTT 1:63/77 2:833/911 R: BP: e-32 TGAAAA.TTT 1:45/53 2:333/350 R: BP: e-31 TG.AAA.TTT 1:53/61 2:538/570 R: BP: e-31 TG.AAA.TTTT 1:40/43 2:254/260 R: BP: e-30 TGAAA..TTT 1:54/65 2:608/645 R: BP:1.0887e GATGAG.T TGAAA..TTT YGR128C")
23
EP:PPI Protein-protein interaction There are high-throughput technologies for identifying hypothetical protein-protein interactions Which ones of these are more likely to be true? Can these predictions help predicting gene function?

25
PPI pairs

26
We have expression data

27
Cluster

28
Trust those within the same cluster

29
PPI are enriched within clusters Ge, Liu, Church, Vidal: Nature Genetics Nov. 2001

30
Protein-protein interactions: which to trust more? Answer: Use the distance measure alone

31
Kemmeren et.al. Randomized expression data Yeast 2-hybrid studies Known (literature) PPI MPK1 YLR350w SNF4 YCL046W SNF7 YGR122W Molecular Cell, Vol. 9, 1133–1143, May, 2002
 PPI MPK1 YLR350w SNF4 YCL046W SNF7 YGR122W Molecular Cell, Vol. 9, 1133–1143, May,")
32
d 0 Interacting pairs of proteins A and B; C and D Which would you trust? A B 1 0 d 13 12 7 C D

33
EP:PPI – combine PPI and expression

34
Results Confidence in 973 out of 5342 putative two-hybrid interactions from S. cerevisiae is increased. Besides verification, integration of expression and interaction data is employed to provide functional annotation for over 300 previously uncharacterized genes. The robustness of these approaches is demonstrated by experiments that test the in silico predictions made. This study shows how integration improves the utility of different types of functional genomic data and how well this contributes to functional annotation.

35
promoter coding DNA GENE 1GENE 2GENE 3GENE 4 DNA transcription factors G1 G2G4 G3 Gene regulation by transcription factors

36
Networks Graphical models Directed labelled graph Nodes genes Arcs/Edges relationships Labels types of relationships

37
Start node (gene) End node (gene) Connection weight, w Graph drawing AB W
 End node (gene) Connection weight, w Graph drawing AB W")
38
Different interpretation of arcs Edges can have different meanings, hence different networks Binding site for A is in front of B Proteins A and B interact Deletion of gene A affects expression of B (is somewhere in regulation cascade) Literature mentions genes together
 Literature mentions genes together")
39
promoter coding DNA GENE 1GENE 2GENE 3GENE 4 DNA transcription factors G1 G2G4 G3 Gene regulation by transcription factors

40
A B C gene B gene C gene D gene A AD BC Deletion mutants (gene knockouts)
")
41
Hughes, T. R. et al: Functional Discovery via a Compendium of Expression Profiles, Cell 102 (2000), 109-126.
,")
42
Green arrows - upregulation Red arrows - downregulation Thickness of arrow represents certainty of direction (up/down)
")
43
A complete graph

44
Features/distributions that do not depend on discretisation thresholds Visual inspection, biological interpretation General statistics and features of the graphs Indegree/Outdegree Complexity of the networks What is the modularity? How many components? Deletion of hot-spots, does it break the net?

45
Filter choose a list of genes (MATING, marked in red) filter for these genes plus neighbouring genes from the graph Mutation network =4
 filter for these genes plus neighbouring genes from the graph Mutation network =4")
46
Mutation network =2

47
lacZ... PromoterOperator Repressor lacIPromoter Activator Glucose LactoseGlucoseGalactose + Galactosidase Lac-Operon Thomas Schlitt

48
Gene regulatory networks What formalisms to use to describe them? When does model correspond to biological reality? How to simulate models on computer Is it possible to verify models by experiments? How to restore networks from raw data without knowing the structure or parameters?

49
Most genes have only a few incoming / outgoing edges, but some have high numbers (>500) number of outgoing edges count... Number of incoming/outgoing edges

50
ARG5,6(108,28) SST2(60,25) TEC1 HPT1 GCN4 ERG3(164,15) GAS1 FUS3 ERG28 QCR2 YER083C GLN3 SPF1 MRT4 CLB2 YHL029C Rank of outdegree Rank of indegree
 SST2(60,25) TEC1 HPT1 GCN4 ERG3(164,15) GAS1 FUS3 ERG28 QCR2 YER083C GLN3 SPF1 MRT4 CLB2 YHL029C Rank of outdegree Rank of indegree")
51
High outdegreeHigh indegree Regulation Metabolism

52
Is there one big dominant connected component and possibly a number of small components, or several components of comparable sizes? Can the network be broken down in several components of comparable size by removing nodes of high degree (i.e., nodes with many incoming or outgoing edges)? Network modularity
. Network modularity.")
53
network modularity Number of connected components in the networks

54
network modularity

55
componentfull network 1% removed 5% removed 10% removed 2.0largest second total 5383 1 4707 1 3682 2 2614 5 2 3.0largest second total 3556 2 2461 2 1385 4 9 764 6 17 4.0largest second total 2354 3 4 1205 3 7 542 6 22 45 28 51 Number of connected components in the networks network modularity

56
Wagner, Genome Research 2002 – there exist many independent modules Featherstone and Broadie, Bioessays 2002 - there is only one giant module All depends on the definition of the module Modularity other opinions

57
Gene disruption network for Saccharomyces cerevisiae

58
a closer look

59
Filter choose a list of genes (MATING, marked in red) filter for these genes plus neighbouring genes from the graph Mutation network =4
 filter for these genes plus neighbouring genes from the graph Mutation network =4")
60
This subnetwork is the result of filtering the full network at =4.0 for the core set marked in red and their next neighbours (red arcs: downregulation, green arcs: upregulation). Mating subnetwork

61
This subnetwork is the result of filtering the full network at =2.0 for the core set marked in red and their next neighbours (red arcs: down- regulation, green arcs: upregulation). Mating subnetwork

62
more information than randomised networks no optimal powerlaw distribution of arcs no obvious modules local networks make sense Conclusion

63
lacZ... PromoterOperator Repressor lacIPromoter Activator Glucose LactoseGlucoseGalactose + Galactosidase Lac-Operon Thomas Schlitt

64
A gene network(?) b1b1 b2b2 b3b3 F1F1 F2F2 r1r1 r2r2
 b1b1 b2b2 b3b3 F1F1 F2F2 r1r1 r2r2")
65
Of transcription factors

66
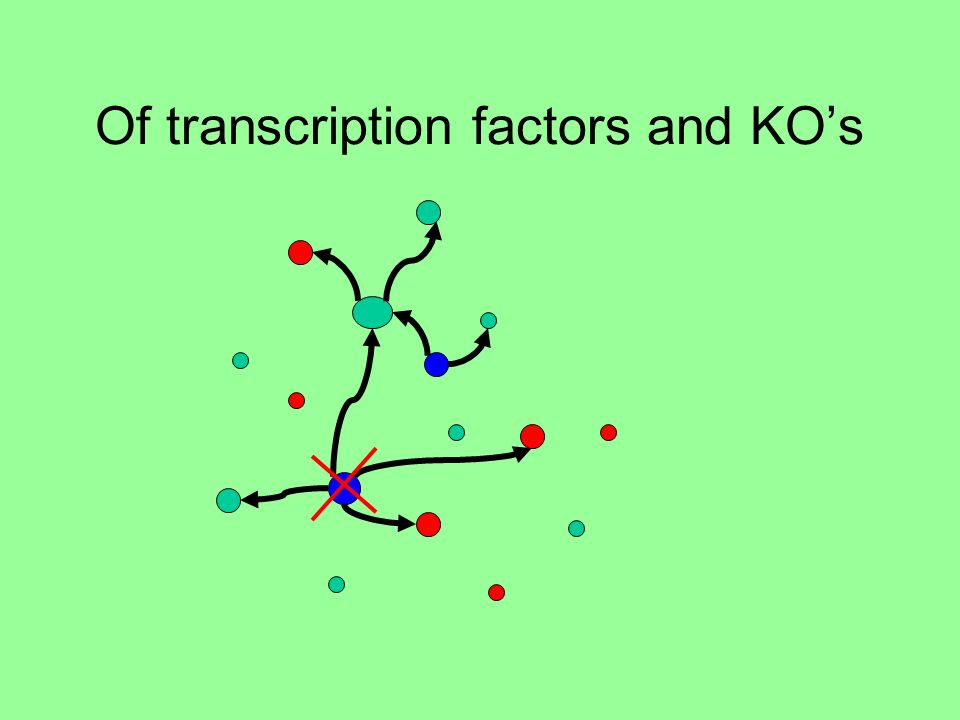
Of transcription factors and KOs

68
Hughes, T. R. et al: Functional Discovery via a Compendium of Expression Profiles, Cell 102 (2000), 109-126.
,")
69
All genes Effectual set and regulation set All genes Transcription factors Disrupted genes t Regulation set of t h Effectual set of h

70
All genes Effectual set and regulation set All genes Transcription factors Disrupted genes g Regulation set of t Effectual set of h

71
How to estimate that the overlap is more than expected by random? G R E R E We assume that the elements of the set E are marked, and pick the set of size |R| at random. Then the size x=| R E| of the intersection are distributed according to hypergeometric distribution. The probability of observing an intersection of size k or larger can be computed according to formula:

72
Data Disrupted genes – 263 disrupted genes excluding drug treatments and haploid states (Hughes et al) Transcription factor binding sites – 356 binding sites, from these 37 experimentally proved (Pilpel et al, 2001)
 Transcription factor binding sites – 356 binding sites, from these 37 experimentally proved (Pilpel et al, 2001)")
73
Disrupted TF Only 5 transcription factors from our set (of known binding sites) were disrupted on the experiments – mbp1, yap1, yaf1, swi5, gcn4 For three of them – mbp1, yap1, gcn4 –the regulation and effectual sets were highly correlating yaf1 is activated with oleate, while in oleate free environment Yaf1 (alias OAF1) disruption does not have significant effect swi5 affects only haploid state, while we use only diploid
 were disrupted on the experiments – mbp1, yap1, yaf1, swi5, gcn4 For three of them – mbp1, yap1, gcn4 –the regulation and effectual sets were highly correlating yaf1 is activated with oleate, while in oleate free environment Yaf1 (alias OAF1) disruption does not have significant effect swi5 affects only haploid state, while we use only diploid")
74
Effectual sets correlating with other TF binding sites From 37 of the experimentally proven binding sites, 20 correlate with one or more effectual sets If the disrupted gene correlate with a regulation set of a different gene, the correlation should be explained

75
Possible explanations why disruption of gene A may correlate with regulation set of a different gene (TF) T: T belongs to the disruption set of A (cascade)
 T: T belongs to the disruption set of A (cascade)")
76
Gene regulation cascade

77
Possible explanations why disruption of gene A may correlate with regulation set of a different gene (TF) T: T belongs to the disruption set of A (cascade) T is regulated by A (transcription or translation) or by a gene on the cascade of A T is modified (e.g., phosphorylated) by A or a cascade of A T and A belongs to the same protein complex A and T are functionally related
 T: T belongs to the disruption set of A (cascade) T is regulated by A (transcription or translation) or by a gene on the cascade of A T is modified (e.g., phosphorylated) by A or a cascade of A T and A belongs to the same protein complex A and T are functionally related")
78
Binding site/disruption correlation summary

79
Conclusion Most of the binding site/disruption set correlations can be explained via Regulation cascades Protein complexes (K. Palin et al, to appear in ECCB 2002, special issue of Bioinformatics)
.")
80
or SAME SYMPTOMS SAME DRUG RESPONSE VARIATION… SNP ACCTG A CGTGGACCTG T CGTGG PHARMACOGENETICS = NEW OPPORTUNITIES SNP = Single nucleotide polymorphisms, 0.1% = 3million

81
SNPs make us unique ~0.1%, 3.000.000 Goal: Associate SNPs with diseases A C G T G A C G T A - AA C T

82
Genotyping: select few Measure Goal: Associate SNPs with diseases, i.e. identify areas of interest

83
Association analysis: p Identifies MANY, if not all contributing genes p Links genes to disease pathways for optimal target selection FROM DISEASE GENES TO DRUG TARGETS

84
Internet GP DNA, Plasma, storage Data + Analysis = Value LIMS Informed consent Personal data Unique code Genotypes Medical information EGV: Process of data collection and handling SNPs

85
Bioinformatics: Where does IT stand? Data modelling, storage, access Inference from data Hypotheses generation and testing Allow novel types of questions to be asked by providing analysis methods that are able to cope with all the information that is available today

86
Compute Infrastructure

87
Bioinformatics: Challenges Knowledge representation, data semantics Data size and its speed of growth New/emerging data collection technologies Integration of different data types Discovery of useful knowledge Modeling living systems as a whole Improved health care products Medical informatics – bringing the knowledge to doctors bench

88
References for this talk http://www.egeen.ee/u/vilo/Publications/ http://www.egeen.ee/u/vilo/Publications/ Jaak Vilo, Misha Kapushesky, Patrick Kemmeren, Ugis Sarkans, Alvis Brazma. Expression Profiler. In Parmigiani,G., Garrett,E.S., Irizarry,R. and Zeger,S.L. (eds), The Analysis of Gene Expression Data: Methods and Software, Springer Verlag, New York, NY. Patrick Kemmeren, Nynke L. van Berkum, Jaak Vilo, Theo Bijma, Rogier Donders, Alvis Brazma, and Frank C.P. Holstege Protein Interaction Verification and Functional Annotation by Integrated Analysis of Genome-Scale Data Molecular Cell 2002, May 24; 9(5) pp. 1133-1143 Johan Rung, Thomas Schlitt, Alvis Brazma, Karlis Freivalds, Jaak Vilo Building and analysing genome-wide gene disruption networks Bioinformatics 2002 Oct;18 Suppl 2:S202-210 European Conference on Computational Biology (ECCB 2002) Kimmo Palin, Esko Ukkonen, Alvis Brazma, Jaak Vilo Correlating gene promoters and expression in gene disruption experiments Bioinformatics 2002 Oct;18 Suppl 2:S172-180;European Conference on Computational Biology (ECCB, 2002)
, The Analysis of Gene Expression Data: Methods and Software, Springer Verlag, New York, NY. Patrick Kemmeren, Nynke L. van Berkum, Jaak Vilo, Theo Bijma, Rogier Donders, Alvis Brazma, and Frank C.P. Holstege Protein Interaction Verification and Functional Annotation by Integrated Analysis of Genome-Scale Data Molecular Cell 2002, May 24; 9(5) pp Johan Rung, Thomas Schlitt, Alvis Brazma, Karlis Freivalds, Jaak Vilo Building and analysing genome-wide gene disruption networks Bioinformatics 2002 Oct;18 Suppl 2:S European Conference on Computational Biology (ECCB 2002) Kimmo Palin, Esko Ukkonen, Alvis Brazma, Jaak Vilo Correlating gene promoters and expression in gene disruption experiments Bioinformatics 2002 Oct;18 Suppl 2:S ;European Conference on Computational Biology (ECCB, 2002).")
89
Acknowledgements Alvis Brazma Patrick Kemmeren, EBI, UMC Utrecht Frank Holstege, UMC Utrecht Thomas Schlitt, Johan Rung EBI Kimmo Palin, Esko Ukkonen, U. Helsinki + the rest of the EBI microarray team

Similar presentations