Download presentation
Presentation is loading. Please wait.

1
Technology shocks and trade in a network: How business cycles emerge from the interaction of autonomous agents. Davoud Taghawi-Nejad

2
The model 1.Agents own one out of four production goods 2.They trade these goods in a network of trading partners 3.They use the goods to produce a final good 4.When profits decrease, agents change their trading partners 5.New technology is being introduced in fixed intervals

3
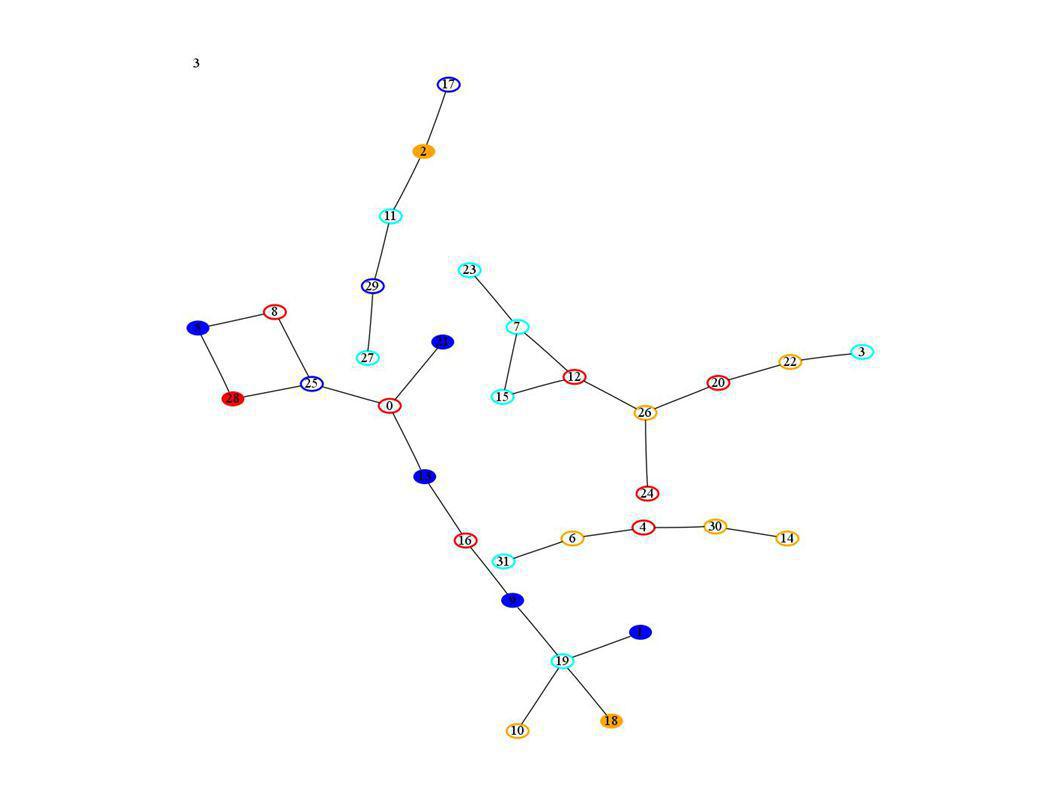
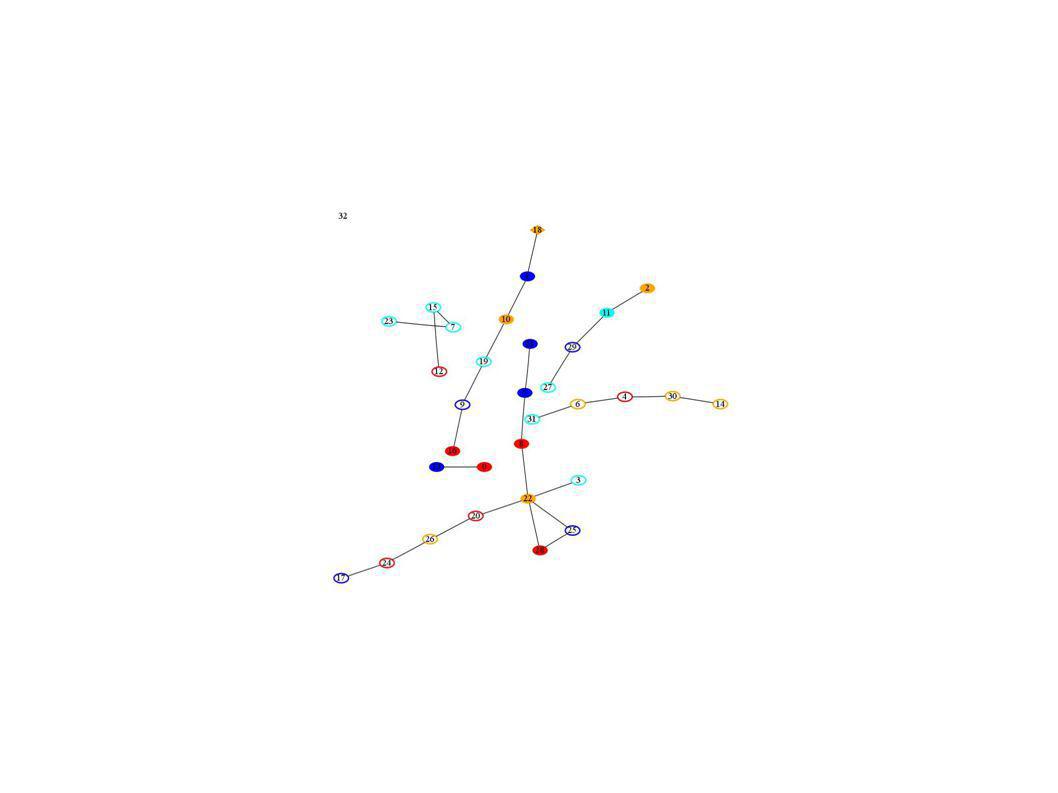
The Representation Agents are represented as nodes Lines connect two trading partners Circles are agents that look for new trading partners because they had decreased profits Squares are agents that introduce a new technology

4
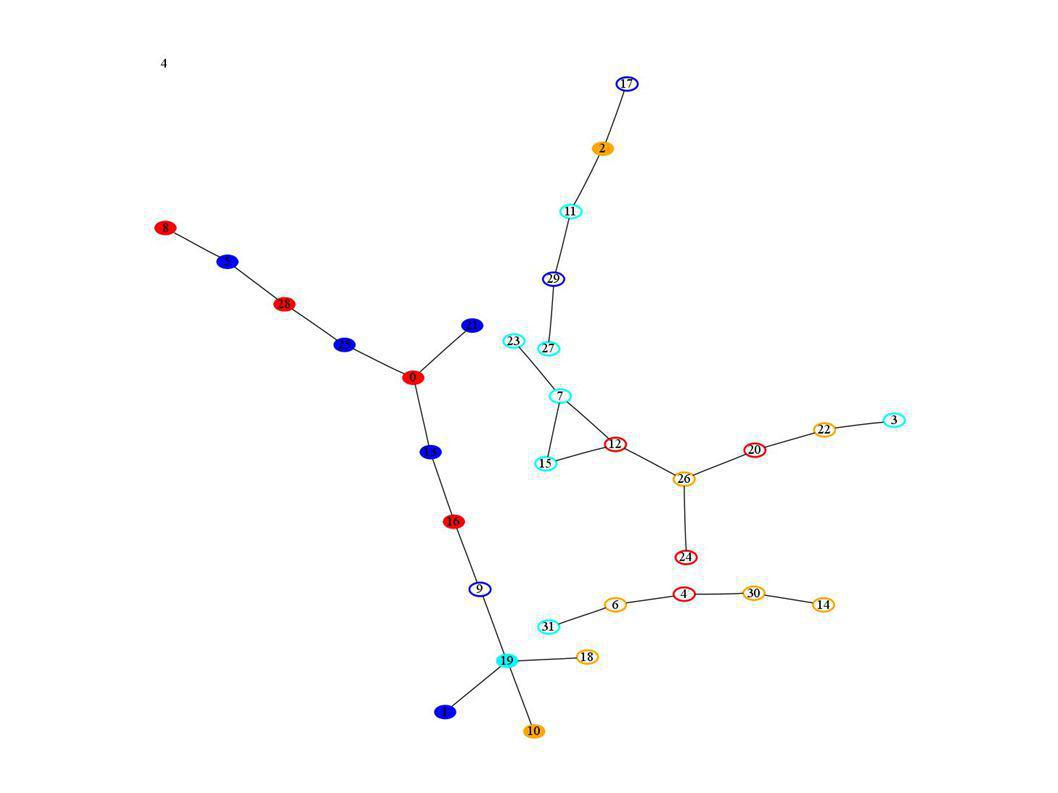
Key Assumption Agents with decreased profits change their trading partners.

5
A new technology affects the trading partners If an agent introduces a new technology he changes his demand and supply. The agents connected to him might have a decrease in profit

6
A snowball effect is started Agents with decreased profits change trading partners. Some of the affected agents can have a decrease in profits. These agents change the trading partners, too. This affects other agents, who in turn start changing partners.

7
Disconnected agent produces less, that decreases the GDP When agents lose a profitable connection they are less productive The GDP decreases. When agents find new trading partners and regain their profits the GDP increases.

8
Agent 14 changes technology The Profit of the agents marked with Pd is decreased

9
The agents marked with change, change their trading partners More agents, marked with Pd, have decreased profits

10
This in turn leads to new changes and other agents to have decreased profits

11
A complete run of the agent-based simulation with 20 agents

21
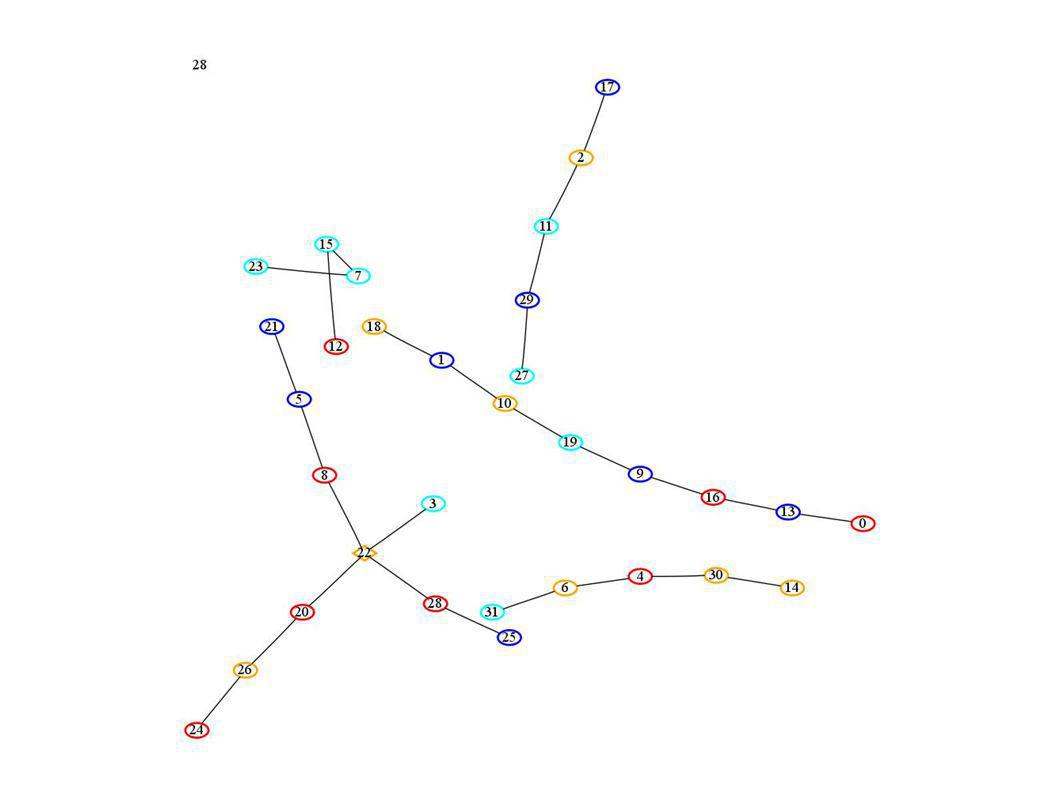
Stable networks Sometimes the network is so efficient that agents do not find new trading partner despite their efforts This corresponds to a high GDP phase

39
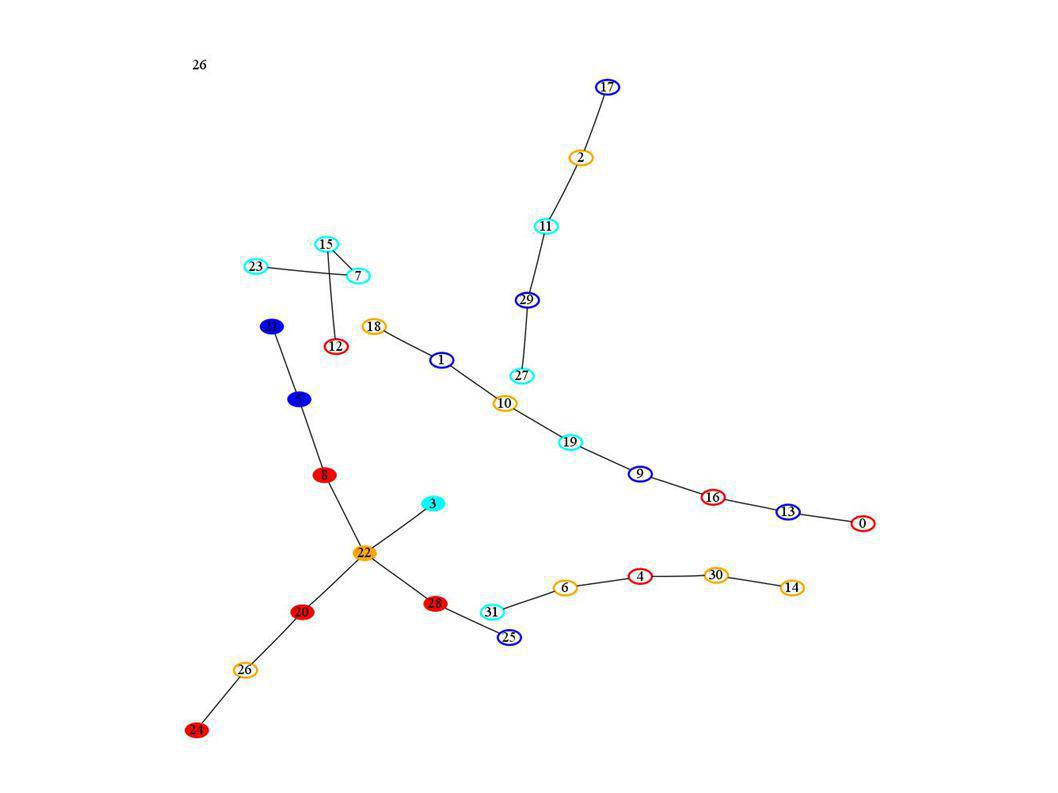
Innovation The agent 20 represented by a square innovates. This usually triggers changes in the network A phase of low GDP starts

47
The ACF shows that the GDP is cyclical

48
The ACF of the US GDP for comparison

49
Another run with different parameters is more similar to US GDP (different scale)
")
Similar presentations


? How is GDP calculated? What is the difference between nominal and.>")

 TRAN Thi Anh-Dao (CARE, University of Rouen, and CEPN, University of.>")


 shows the quantity of real GDP produced at different.>")


