Download presentation
Presentation is loading. Please wait.

1
Technology that optimises water distribution networks

2
THE IMPORTANCE OF OPTIMISING WATER PRESSURE

3
PRESSURE MANAGEMENT CHALLENGE

4
BASIC PRESSURE MANAGEMENT + Fixing pressure at the PRV outlet + Leads to excessive pressure 100% of the time at critical point + Potential response: basic time & flow modulation + Weak control of pressure vs target + Inability to respond and adapt to changing network circumstances

5
ADVANCED PRESSURE MANAGEMENT + Total visibility into network performance + Remote management of pressure + Automatically and continuously optimised pressure based on demand patterns + Delivers the right pressure (and no more) in the network all the time
 in the network all the time")
6
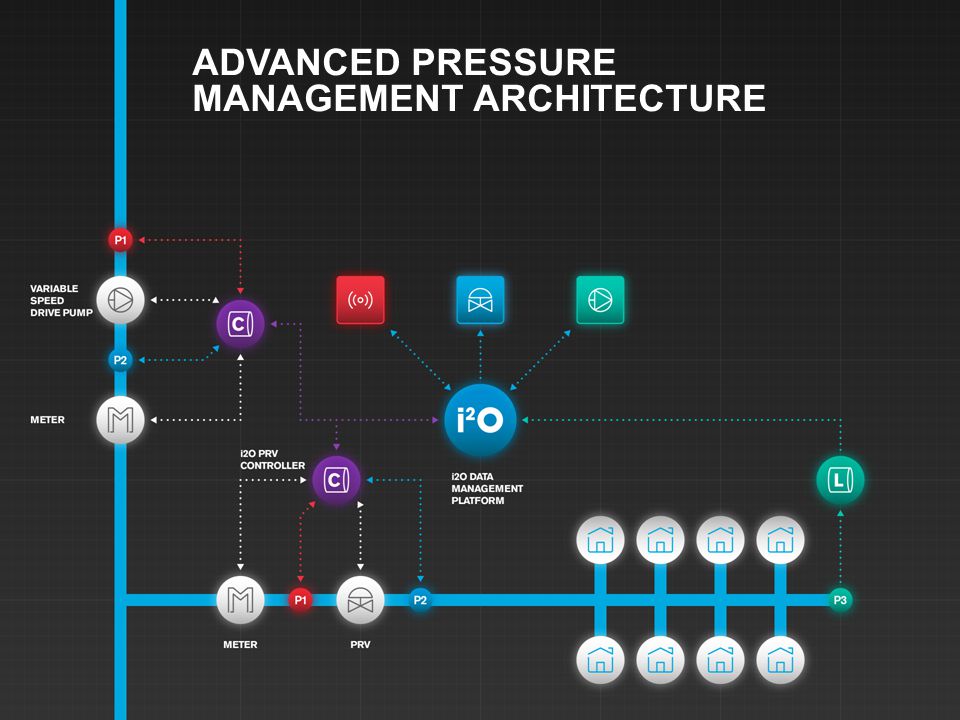
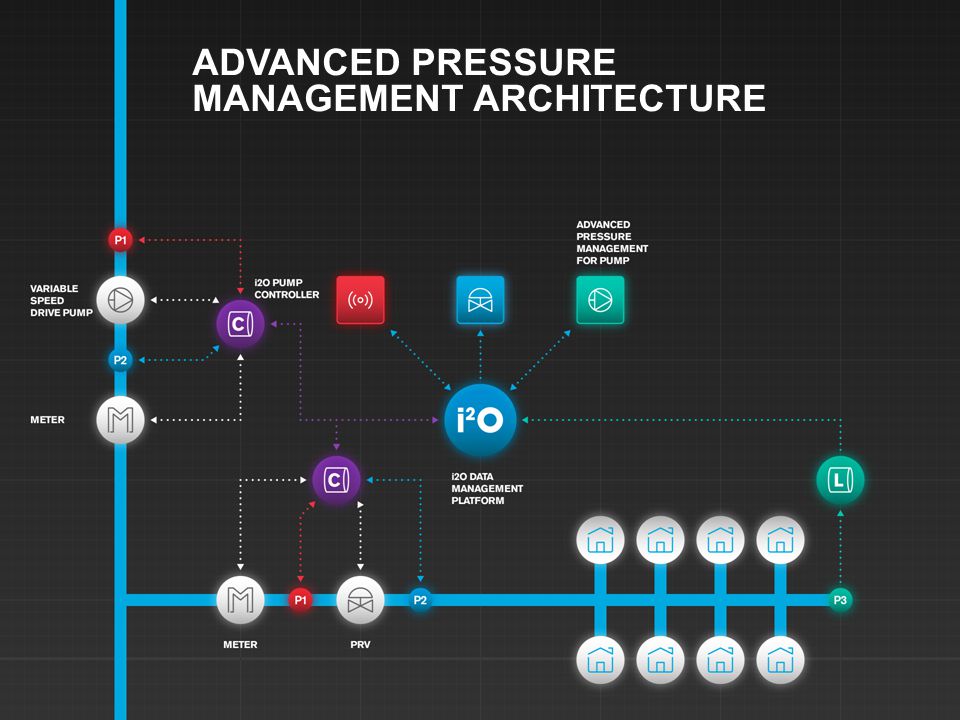
ADVANCED PRESSURE MANAGEMENT ARCHITECTURE

13
1. Controller 2. APV 3. PRV i2O SYSTEM – PRV CONTROL i2O PRV control hardware + Remote control, optimisation and monotoring of all diaphragm actuated PRVs + Smooth and reliable control and monitoring + Simple installation takes 1.5hrs by network technicians 1 2 3

14
i2O SYSTEM – PRV CONTROL components Controller + Logs pressure and flows with high accuracy + GPRS and Bluetooth communication + Low power consumption – 5 year battery life + Robust, waterproof enclosure APV (Advanced Pilot Valve) + Accurate control over 32m range + Smooth preassure change – no surge + Any PRV Critical Point Logger + Logs pressure with high accuracy + GPRS and Bluetooth communication + Low power consumption – 5 year battery life + Robust, waterproof enclosure
 + Accurate control over 32m range + Smooth preassure change – no surge + Any PRV Critical Point Logger + Logs pressure with high accuracy + GPRS and Bluetooth communication + Low power consumption – 5 year battery life + Robust, waterproof enclosure")
15
i2O SYSTEM – SOFTWARE INTERFACE +Secure +Integrated system – see data and act on it +Scalable throughout the business +Quick and easy to implement +Cost effective

16
i2O SYSTEM – NETWORK MONITORING

17
ADVANCED PRESSURE MANAGEMENT +Remote pressure optimisation +Remote diagnostics +Quick DMA set-up and installation +Scheduled pressure control +Scheduled alarm control

18
i2O – Worked Example : Implementation Flow (l/s)/Pressure (m) Time
/Pressure (m) Time")
19
LEAKAGE REDUCTION + Each percentage point of pressure reduction in a water network leads to a corresponding decrease in leakage + i2Os solutions have reduced leakage by 10 to 50% in hundreds of water networks. Syabas: 35.4 MLD reduction in 178 DMAs

20
BURST FREQUENCY REDUCTION After i2O Before i2O + Minimizing pressure peaks and softening fluctuations reduces the frequency of bursts + i2Os solutions have reduced burst frequency by 40% or more in customers water networks. Veolia Water UK installation

21
LOWER OPERATING COSTS + Remote monitoring gives managers visibility to network performance and events from any online connection or location + Remote PRV control eliminates site visits to adjust PRVs manually + Reduced leakage and bursts decrease need for find and fix activity + Early detection of asset degradation reduces need for routine maintenance visits

22
IMPROVED CUSTOMER SERVICE LEVELS + Many water networks service levels suffer during peak demand, leading to complaints and fines. + i2Os solutions maintain the right pressure, without abrupt changes, minimising customer service problems.

23
ENERGY SAVINGS + The lower the water pressure you supply to a network, the lower your energy consumption + Installed on pumps with variable speed drives, Advanced Pressure Management from i2O can reduce energy consumption by more than 20% APA Nova Ploiesti (Romania) installation
 installation")
24
EXTENDED MAINS LIFETIMES + Many water networks are at or near their service lifetimes + Burst frequency is the key trigger for capital- intensive pipe replacement investments + Reduced burst frequency significantly extends pipe lifetimes

25
i2O WORLDWIDE 900+ systems installed in 40 utilities in 21 countries

26
i2O MALAYSIA 4 systems 10.36 Ml/d 3 systems 1.21 Ml/d Logging in progress 1 system + 3 reservoir sensors 229 systems 51.36 Ml/d 6 systems 3.59 Ml/d 8 systems 2.78 Ml/d Total 251 systems Saving 69.5 Ml/d

27
+ Advanced Pressure Management technology is quick to implement: Under 2 hours + Rapid NRW reduction: Over 69 Ml/d + Deferred capital expenditure needed for new water plant + Average payback for Malaysian Water Companies: 5 months IMPLEMENTING i2O SOLUTIONS IN MALAYSIA

28
SYABAS + Largest water concessionaire in Malaysia (supplies 7 million consumers) + Cut leakage by 40 million litres per day + Reduced burst frequency by 48% + Expanded Advanced Pressure Management from 50 to 100 to 200 installations over 2 years ADVANCED PRESSURE MANAGEMENT EXAMPLES
 + Cut leakage by 40 million litres per day + Reduced burst frequency by 48% + Expanded Advanced Pressure Management from 50 to 100 to 200 installations over 2 years ADVANCED PRESSURE MANAGEMENT EXAMPLES")
29
Manila Water + Serves more than 6 million consumers in Manila, Philippines + 10 MLD pump station cut energy consumption 24% on weekends, 14% on weekdays + Cut network leakage by 800,000 litres per day on weekends, 500,000 liters per day on weekdays + Radically improved level of service from network pumps (failed daily prior to i2O installation)
")
30
ADVANCED PRESSURE MANAGEMENT EXAMPLES Veolia Water + Provides water and wastewater services throughout the UK + Achieved savings on operational costs of 80% + Improved customer service + Reduced water loss from eight problem DMAs by more than 1.5 MLD

31
During the two last years the number of mains repairs was reduced by nearly 75% in DMAs equipped with i2O systems. ADVANCED PRESSURE MANAGEMENT EXAMPLES +Number of mains repairs (per thousand properties) identified by type of pressure management
 identified by type of pressure management.")
32
ADVANCED PRESSURE MANAGEMENT EXAMPLES NWC and Jeddah City Business Unit (JCBU) + Advanced Pressure Management pilot on two District Zones + Systems installed and optimised in 2 days + 20% pressure reduction + 10% leakage savings + 40% reduction in pipe bursts + Remote control capability improved efficiency + Enhanced benefits for District Zones with continuous supply
 + Advanced Pressure Management pilot on two District Zones + Systems installed and optimised in 2 days + 20% pressure reduction + 10% leakage savings + 40% reduction in pipe bursts + Remote control capability improved efficiency + Enhanced benefits for District Zones with continuous supply")
33
ADVANCED PRESSURE MANAGEMENT EXAMPLES NWC and Jeddah City Business Unit (JCBU) Change from a fixed PRV outlet to a flow modulated pressure within the Zone Pressure is stabilized at critical point inside the Zone
 Change from a fixed PRV outlet to a flow modulated pressure within the Zone Pressure is stabilized at critical point inside the Zone")
34
PROVEN RETURN ON INVESTMENT + i2O customers typically achieve ROI within 6-12 months Sources of ROITypical Benefit Leakage reduction20% Burst reduction40%+ Operating cost reduction40% less find and fix; Fewer scheduled visits Customer satisfaction improvementReduce network-related complaints Energy savings20% Asset lifetime improvement5+ years

Similar presentations


 April 09, 2009 Hanlab Co., Ltd.>")
 The Tivoli ® Configuration & Operations management solution from IBM.>")


