Download presentation
Presentation is loading. Please wait.

1
Day 19 ELC 347/BUS 348/PSA 347

2
Agenda Questions? IP Part 4 IP Part 5 Assignment 6 Corrected
Missing .mmp file with costs update IP Part 5 Due Nov 18 Developing a Project Schedule Assignment 6 Corrected 3 A’s and 1 B Assignment 7 Posted Only one more Exam 2 Corrected 2 A’s, 1 B and 1 C Finish Critical Chain Project Scheduling

3
Finals Rescheduling Do IP Project presentation on Dec 12
Exam 3 done asynchronously via Blackboard on Dec 16 Final IP Project Due Dec 18

4
Project Scheduling: Lagging, Crashing, and Activity Networks
Chapter 10 Project Scheduling: Lagging, Crashing, and Activity Networks

5
Boeing 787 1st Delivery September 25, 2011

6
Chapter 10 Learning Objectives
After completing this chapter, students will be able to: Apply lag relationships to project activities. Construct and comprehend Gantt charts. Recognize alternative means to accelerate projects, including their benefits and drawbacks. Understand the trade-offs required in the decision to crash project activities. Develop activity networks using Activity-on-Arrow techniques. Understand the differences in AON and AOA and recognize the advantages and disadvantages of each technique.

7
Lags in Precedence Relationships
The logical relationship between the start and finish of one activity and the start and finish of another activity. Four logical relationships between tasks Finish to Start Finish to Finish Start to Start Start to Finish

8
Finish to Start Lag Most common type of sequencing
Shown on the line joining the modes Added during forward pass Subtracted during backward pass This lag is not the same as activity slack A Spec Design 6 B Design Check 5 C Blueprinting 7 Lag 4

9
Finish to Finish Lag Two activities share a similar completion point
The mechanical inspection cannot happen until wiring, plumbing, and HVAC installation are complete A Plumbing 6 B HVAC 5 C Inspection 1 D Wiring Lag 3

10
Start to Start Lag Logic must be maintained by both forward and backward pass A Plumbing 6 B HVAC 5 C Inspection 1 D Wiring Lag 3

11
Start to Finish Lag Least common type of lag relationship
Successor’s finish dependent on predecessor’s start D Wiring 6 Lag 3 A Plumbing 6 B HVAC 5 C Inspection 1

12
Gantt Charts Establish a time-phased network
Can be used as a tracking tool Benefits of Gantt charts Easy to create and comprehend Identify the schedule baseline network Allow for updating and control Identify resource needs

13
Create a Gantt chart based on the activities listed in the table. Task
Time Pred Z 8 -- U 3 W Y 5 T 6 V X S 7 U,T 4 Y,X R 9 Task ES EF LS LF Z Y X W V U T S R gantt.mpp

14
Completed Gantt Chart for Project Delta
FIGURE 10.8 Copyright © 2013 Pearson Education, Inc. Publishing as Prentice Hall

15
Gantt Chart for Project Delta with Critical Path Highlighted
FIGURE 10.9 Copyright © 2013 Pearson Education, Inc. Publishing as Prentice Hall

16
Gantt Chart with Resources Specified
FIGURE 10.10 Copyright © 2013 Pearson Education, Inc. Publishing as Prentice Hall

17
Gantt Chart with Lag Relationships
FIGURE 10.11 Copyright © 2013 Pearson Education, Inc. Publishing as Prentice Hall

18
Gantt Chart with Lag Relationships

19
Principal methods for crashing
The process of accelerating a project Principal methods for crashing Improving existing resources’ productivity Changing work methods Compromise quality and/or reduce project scope Institute fast-tracking Work overtime Increasing the quantity of resources

20
Managerial Considerations
Determine activity fixed and variable costs The crash point is the fully expedited activity Optimize time-cost tradeoffs Shorten activities on the critical path Cease crashing when the target completion time is reached the crashing cost exceeds the penalty cost

21
Formula Slope = crash cost – normal cost normal time – crash time
CRASHING ACTIVITIES – AN EXAMPLE Formula Slope = crash cost – normal cost normal time – crash time Example – Calculating the Cost of Crashing SUPPOSE: NORMAL ACTIVITY DURATION = 8 WEEKS NORMAL COST = $14,000 CRASHED ACTIVITY DURATION = 5 WEEKS CRASHED COST = $23,000 THE ACTIVITY COST SLOPE = 23,000 – 14, or, $9, = $3,000 per week 8 –

22
Project Activities and Costs
Table 10.1 Copyright © 2013 Pearson Education, Inc. Publishing as Prentice Hall

23
FIGURE 10.14 Time–Cost Trade-Offs for Crashing Activities
Copyright © 2013 Pearson Education, Inc. Publishing as Prentice Hall

24
Project costs Pre Normal Crashed Crash/day Days Gained activity
Duration Cost A 5 1000 3 1500 250 2 B 7 700 6 300 1 C 2500 4000 D - E C,D 9 3750 9000 1750 F 4 1600 900 G 2400 3000 H E,F,G 15000 2000 Total 22450 37500

25
Normal Netw0rk 7 4 3 5 9 9 5 6 Project time = 28 days
Project Cost = $22450

26
Fully Crashed Netw0rk Project time = 19 days Project Cost = $37,500

27
Partially Crashed Netw0rk
7 4 3 6 Project time = 19 days Project Cost = $34,200 (save $3,300)
")
28
FIGURE 10.16 Relationship Between Cost and Days Saved in a Crashed Project
Copyright © 2013 Pearson Education, Inc. Publishing as Prentice Hall

29
Other costs Previous examples only includes direct costs What about
Indirect costs (overhead) $ per day overhead Late penalties $ per day late
 $ per day overhead. Late penalties. $ per day late.")
31
What is the lowest cost to complete this project in 53 weeks
What is the lowest cost to complete this project in 53 weeks? Times are in weeks and costs in dollars. Activity Pred Normal Time Min Time Normal Cost Crash Cost A -- 14 9 500 1500 B 5 2 1000 1600 C 10 8 2000 2900 D B, C 2500 E 6 1900 F 3000 G E, F 7 4 600 1800 H 15 11 3600 Initial early and late start and finish times Task ES EF LS LF Slack A B C D E F G H Project 63 Reduce A by 5 days at $200/week = $1000 Project length is now 58 weeks Reduce G by 3 days at $400/week = $1200 Project length is now 55 weeks Reduce C by 2 days at $450/week = $900 Project length is now 53 weeks Total cost to finish project in 53 weeks is $3100 more than normal cost of $9800 crash.mpp, crash.xls

32
Activity on Arrow Networks
Activities represented by arrows Widely used in construction Event nodes easy to flag Forward and backward pass logic similar to AON Two activities may not begin and end at common nodes Dummy activities may be required

33
Notation for Activity-on-Arrow (AOA) Networks
FIGURE 10.18 Copyright © 2013 Pearson Education, Inc. Publishing as Prentice Hall

34
Project delta Activity Pre Duration A 5 B C 6 D B,C 13 E F 4 G 9 H
2

35
Sample Network Diagram Using AOA Approach
FIGURE 10.19 Copyright © 2013 Pearson Education, Inc. Publishing as Prentice Hall

36
Representing Activities with Two or More Immediate Successors(Wrong)
FIGURE 10.20A Copyright © 2013 Pearson Education, Inc. Publishing as Prentice Hall

37
Alternative Way to Represent Activities with Two or More Immediate Successors (Wrong)
FIGURE 10.20B Copyright © 2013 Pearson Education, Inc. Publishing as Prentice Hall

38
Representing Activities with Two or More Immediate Successors Using Dummy Activities (Better)
FIGURE 10.20C Copyright © 2013 Pearson Education, Inc. Publishing as Prentice Hall

39
Partial Project Delta Network Using AOA Notation
FIGURE 10.21 Copyright © 2013 Pearson Education, Inc. Publishing as Prentice Hall

40
Completed Project Delta AOA Network
FIGURE 10.22 Copyright © 2013 Pearson Education, Inc. Publishing as Prentice Hall

41
Project Delta Forward Pass Using AOA Network
FIGURE 10.23 Copyright © 2013 Pearson Education, Inc. Publishing as Prentice Hall

42
Project Delta Backward Pass Using AOA Network
FIGURE 10.24 Copyright © 2013 Pearson Education, Inc. Publishing as Prentice Hall

43
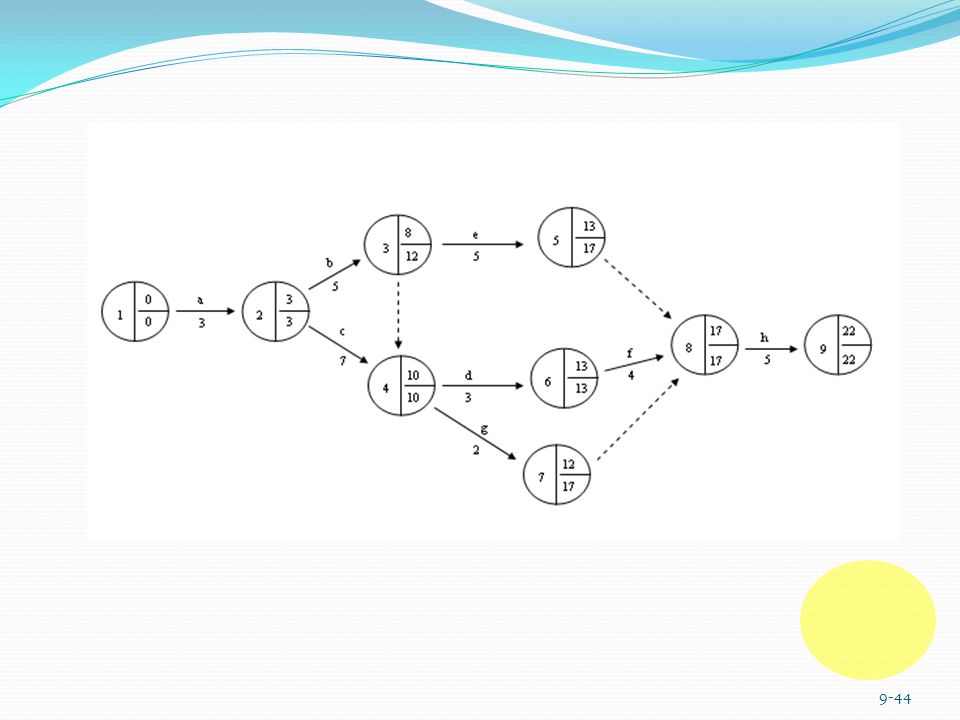
Calculate early and late start and finish times for all activities.
Use AOA to sketch the network that represents the project as described in the table. Calculate early and late start and finish times for all activities. Activity Time Pred A 3 -- F 4 D B 5 G 2 C 7 H E,F,G B,C E Task ES EF LS LF A B C D E F G H K

45
Controversies in the Use of Networks
Networks can be too complex Poor network construction creates problems Networks may be used inappropriately When employing subcontractors The master network must be available to them All sub-networks must use common methods Positive bias exists in PERT networks

46
Summary Apply lag relationships to project activities.
Construct and comprehend Gantt charts. Recognize alternative means to accelerate projects, including their benefits and drawbacks. Understand the trade-offs required in the decision to crash project activities. Develop activity networks using Activity-on-Arrow techniques. Understand the differences in AON and AOA and recognize the advantages and disadvantages of each technique.

47
Copyright © 2013 Pearson Education, Inc. Publishing as Prentice Hall

Similar presentations


 1.Set PowerPoint to work in Outline. View/Normal click.>")


