Download presentation
Presentation is loading. Please wait.

1
Graphing Notes “A” Why Scientists Use Graphs Types of graphs
Advantages and Disadvantages Creating Graphs Reading Graphs

2
Why Do Scientists Use Graphs?
Scientists use graphs for many reasons, most importantly graphs: Organize a scientists data. Are easy to understand compared to a long paragraph discussing the data. Are interesting to look at and capture the readers interest. Why Do Scientists Use Graphs?

3
By using graphs it allows the scientist to display the results of the experiment in such a way that helps get their message across to non-scientists. Graphs are critical in scientific fields such as medicine, physics, and are used frequently in the auto industry to show safety test information in magazines. Why we use graphs cont.

4
The Four Parts Of A Graph
A properly made graph has four main components: A title Data X and Y axis labels A key

5
Parts of a Graph

6
For our purposes we will discuss three major types of graphs:
Line Graphs Bar Graphs Pie Graphs Each type of graph has a particular advantage and disadvantage to using it instead of the other types of graphs. Types of Graphs

7
Line Graphs Line graphs are created by plotting points of data and then connecting the dots to form a line. Multiple sets of data can easily be shown. The advantages of a line graph include: Ability to see sharp increases or decreases in data. Ability to compare two or more sets of data. The disadvantages of a line graph include: Not being able to relate parts of a whole, such as percentages. If you do not connect your data points then you have made a scatter plot graph.

8
Let’s Create A Line Graph
Create a line graph of the following data: Day: Temperature in Degrees Celsius : 1 54 2 60 3 74 4 82

10
Bar Graphs Bar graphs are made by plotting the highest data point and then shading in the area underneath the point to create bars or columns of data. Bar graphs are useful in creating graphs that show a large change between two types of data sets. Bar Graphs

11
Bar Graphs The advantages of a bar graph include:
Ability to show similarities and differences with different sets of data. Utilizes color and size to capture readers interest. The disadvantages of a bar graph include: Not being able to relate parts of a whole, such as percentages. Sometimes considered to be a less accurate type of graph for scientists and business persons to use. Bar Graphs

12
Let’s Create A Bar Graph
Day Temp in Warren Temp in Traverse City 1 54 50 2 60 70 3 74 64 4 82 80 Create a bar graph of the following data:

14
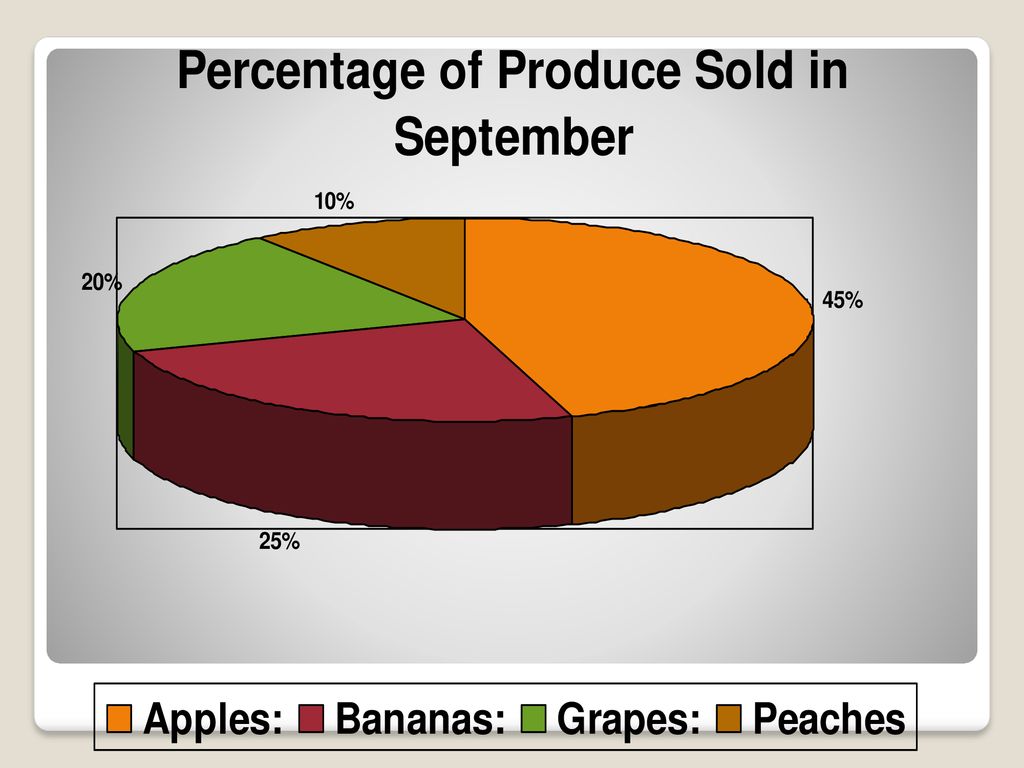
Pie graphs are the most colorful and easy to understand of all graphs we are working with.
Pie graphs show relationships between percentages and parts of a whole. A pie graph looks just like it sounds, it is round like a pie, and has slices of data that are different sizes. Pie Graphs

15
Pie Graphs The advantages of a Pie graph include:
Uses color to catch your readers attention. Easy to read and understand relationships. Relates percentages and parts of a whole. The disadvantages of a Pie Graph include: Inability to compare two different data sets on one graph. Cannot graph data points that change over time. Pie Graphs

17
No matter what type of graph you choose to represent your data it is very important that you:
Graph accurately, make sure your data points are precisely where they should be. You have your X and Y axis labels with both words and units. Your key is clear and easy to understand. Creating Graphs

18
Just as it is important for you to be able to accurately create a graph, you must be able to read a graph as well. Reading graphs requires you to know what units the data is shown in and how to read down to the X and Y axis labels. Let’s practice reading a bar graph together before you practice on your own. Reading Graphs

19
Conclusion Now that you know the advantages and disadvantages of each type of graph you are ready to practice creating and reading graphs.

Similar presentations


 The Independent Variable. A change in this variable affects the y variable. >")


