Download presentation
Presentation is loading. Please wait.

1
Intra-Car Wireless Sensor Networks Using RFID : 79893001

2
Outline Introduction Problem statement Experimental method and results Power delay profile measurements Statistical analysis Maximum packet delay Conclusion

3
Introduction In modern cars the sensors are connected to the central unit with wires. As the number of sensors in cars keep increasing every year. Building a wireless sensor network in a car has important advantages in terms of cost reduction. One option for implementing such an intra-car wireless network is to use RFID technology.

4
Problem statement

5
The current wired architecture has the following disadvantage 1. The vast amount of wiring shrinks the layout space and decrease the serviceability and reliability. 2. The cost of the data and power wires for the sensors and the manufacturing and assembly operations could cost up to hundreds of dollars.

6
3. The wires increase the weight of the car and decrease the fuel efficiency. 4. sensors cannot be installed in some of the locations (tires, steering wheel, etc.) because they cannot be reached by wires.
 because they cannot be reached by wires..")
7
One solution to this problem could be the use of RFID technology whereby the wires from sensors to the serial data bus are replaced by a Reader and several Tags Tat will be connected to the sensors.

9
Experimental method and results Four different communication channels were identified inside a car: 1. Tags on the hood (H) 2. Tags in the trunk (TR) 3. Tags inside the engine compartment (IE) 4. Tags under the engine compartment (UE)
 2. Tags in the trunk (TR) 3. Tags inside the engine compartment (IE) 4. Tags under the engine compartment (UE).")
10
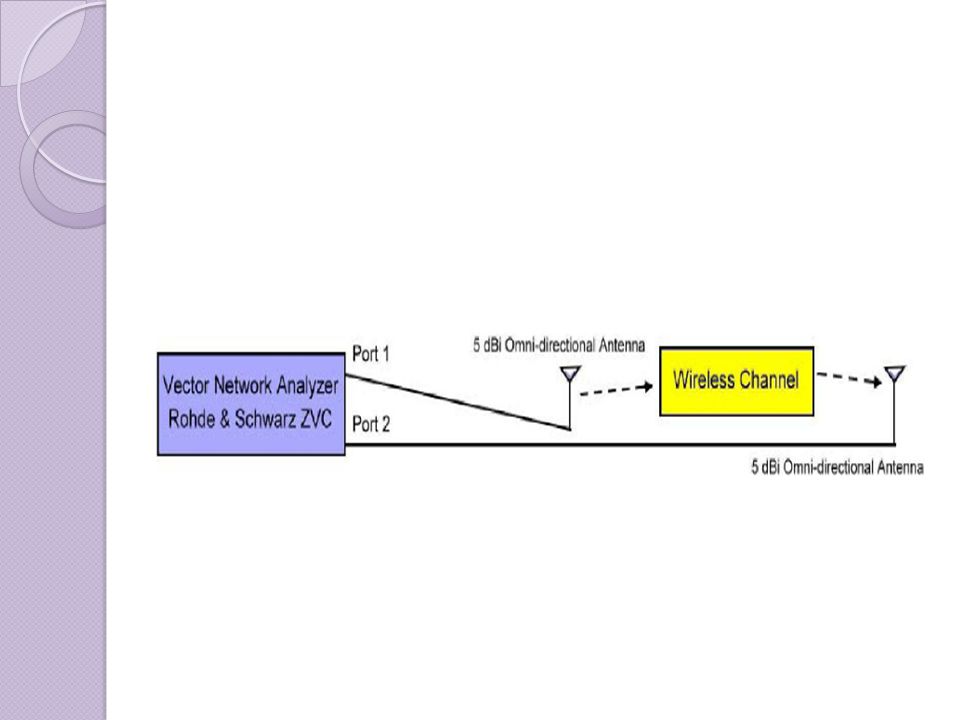
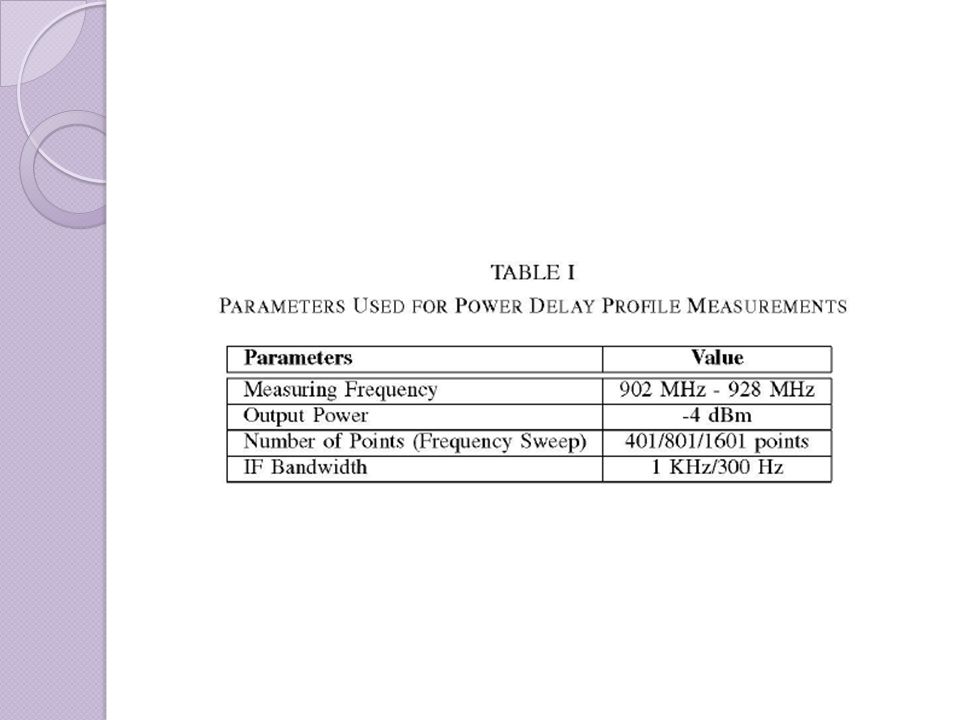
Power Delay Profile Measurements: The power delay profiles (PDF) of all four channels were measured using the vector network analyzer and two 5 dBi omni-directional antennas.
 of all four channels were measured using the vector network analyzer and two 5 dBi omni-directional antennas.")
13
The measurements were repeated several times at each of the locations described in Table II on the campus of Carnegie Mellon University.

15
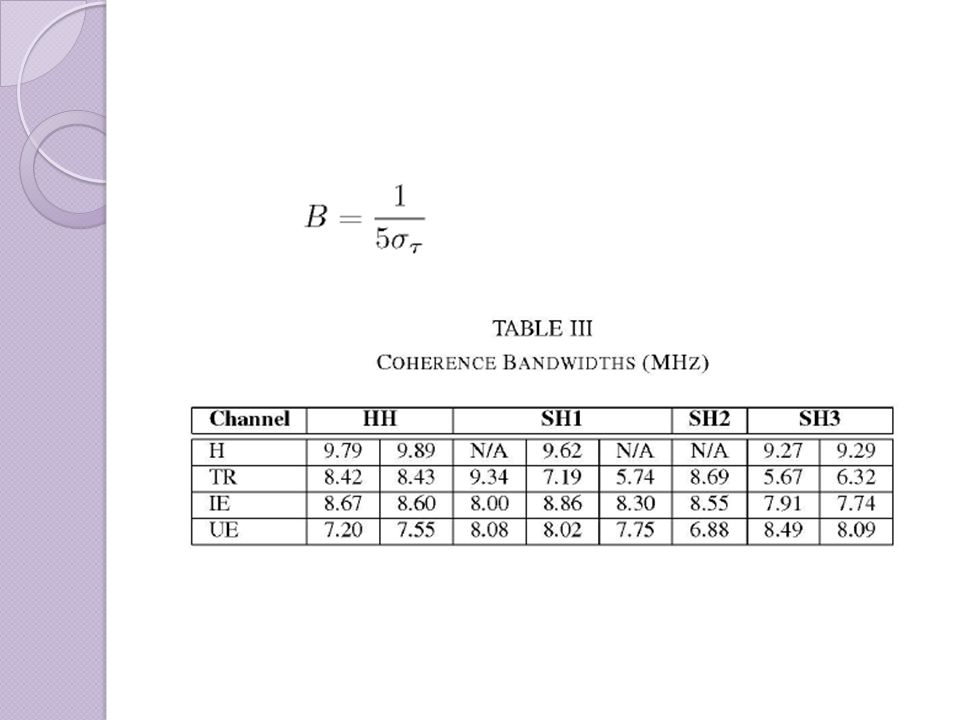
H channel is the best-case channel,because no obstructions between the transmitting and receiving antennas. UE channel has a low receiving power, hence low-power reflections can cause higher RMS delay. TR channel is the worst in SHI and SH3 data set and this might be due to the reflections caused by various objects put in the trunk.

16
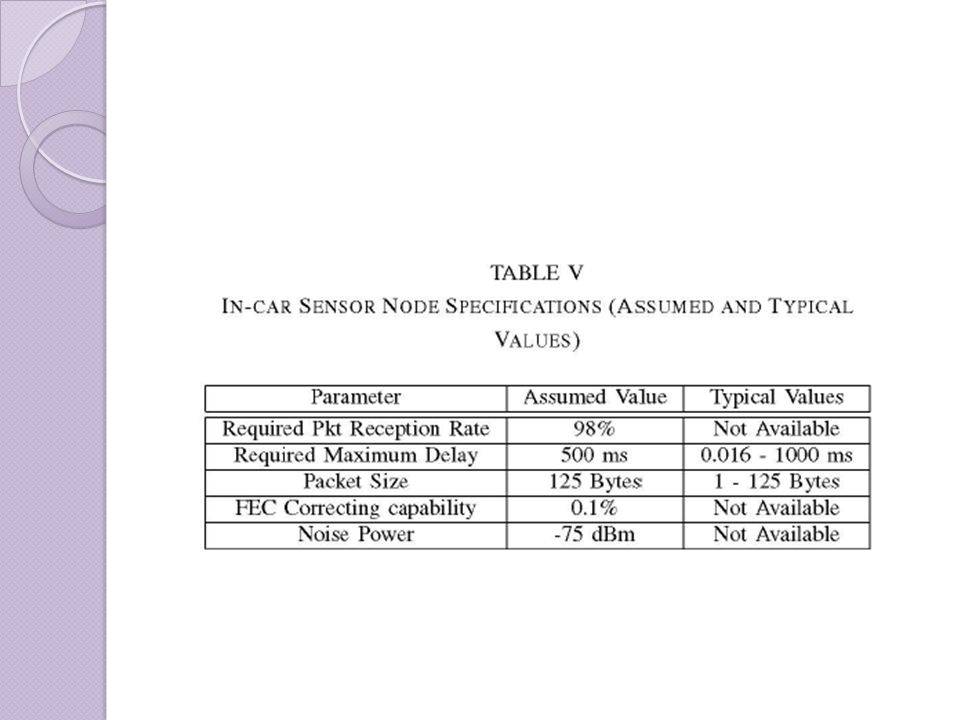
Statistical analysis The method to obtain an upper bound on the optimum transmitting power which can satisfy the requirements of the in-car sensors.

18
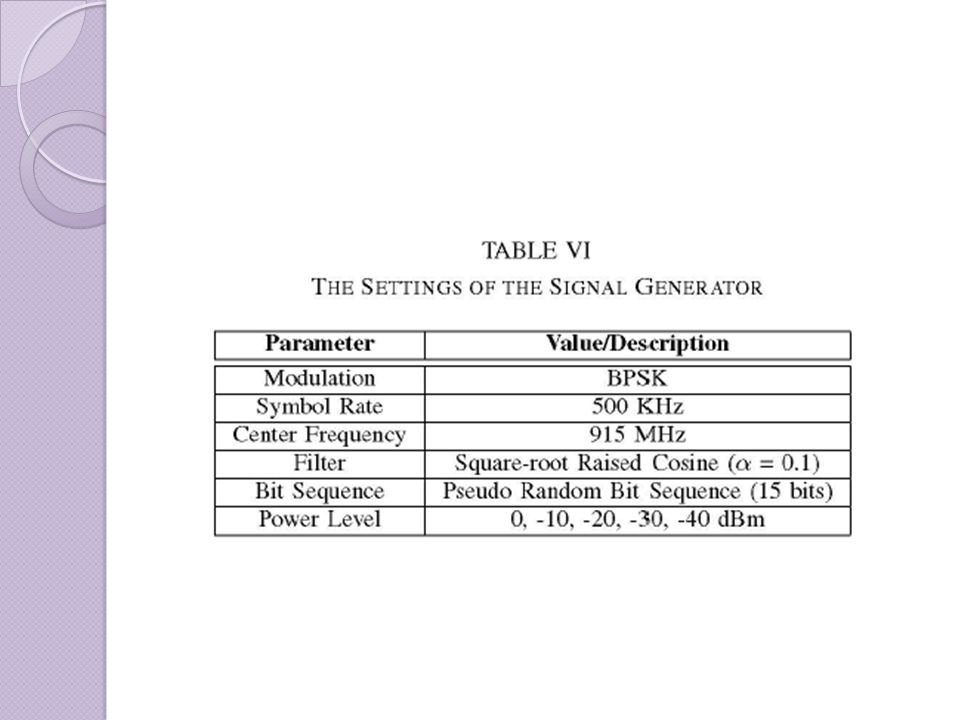
Assuming BPSK is the modulation format used, a bit error rate (BER) of 0.1% corresponds to a received power level of -67.665 dBm. To calculate the appropriate transmitting power when average received power is given, the pathloss of the channel is needed. The Pathloss (in dB), PL, is given by PL = PRX - PTX
, PL, is given by PL = PRX - PTX.")
21
For each transmitting power setting/wireless channel pair, the BPSK signal was transmitted for 5 minutes. The real-time spectrum analyzer recorded the waveform in time domain and arranged it in frames. The final data we got is a vector of received power values representing the received power over this 5- minute period.

23
Figure 6 show that the in-car wireless channels can support 86%, 98%, 99%, and 90% of packet reception rate for the H, the TR, the IE, and the UE channels. This shows that the TR and the IE channels are good enough to support most of the in-car sensor applications while more experimental data is needed for the H and the UE channels to have a smaller confidence interval and obtain a bound of higher packet reception rate.

24
A passive RFID tag has a requirement of having the received power higher than the "chip sensitivity" threshold. When transmitting power is higher, the fade proportion plot is more concentrated and represents a better channel condition.

25
Maximum Packet Delay To obtain a tighter bound, additional experimental data measured with higher transmitting power will be needed. Average Fade Duration (AFD) corresponds to the average of the time duration in which received power continuously stays below a threshold.
 corresponds to the average of the time duration in which received power continuously stays below a threshold..")
27
In Figure 7,the smallest threshold value corresponds to the smallest fade duration value, which is also the smallest maximum packet delay value that can be satisfied by each channel. The H, TR, IE, and UE channels can support maximum packet delays of 130 ms, 170 ms, 310 ms, and 360 ms, respectively.

28
The maximum packet delay requirements of most in-car sensors can be satisfied at the expense of a small amount of additional transmitting power.

29
Conclusion In terms of reliability, the conducted studies show that TR and the IE channels can support at least 98% packet reception rate of the sensors while all the 4 in-car wireless channels considered can support the required maximum packet delay of less than 500 ms. The major advantage of passive RFID is its low-cost, commercially-available components.

Similar presentations


 802.11 DSSS (direct sequence.>")


:37.>")
, Feb, 2008. 05/05 Feb 2009.>")
 2007 05 18 Wireless.>")


 1 Chapter 2 Channel Measurement and simulation 2.1 Introduction Experimental and simulation techniques The.>")


