Download presentation
Presentation is loading. Please wait.

1
FIRST SLIDE

2
LRFD Update for Materials/Geotechnical
At GRAC Meeting John Schuler, PE Program Manager Virginia DOT Materials Division October 31, 2011

3
Purpose of Presentation
Provide common ground between Materials & Bridge, give Materials & Geotechs background on LRFD initiative

4
LRFD – poor choice of words
LRFD – poor choice of words? Concrete – 1950s Steel – 1960s Transportation (Geotech) – 1990s
 – 1990s")
5
Why LRFD. Steel vs Pre-Stressed Industries
Why LRFD? Steel vs Pre-Stressed Industries? Purpose – Uniform Safety (not economy)
")
6
Data obtained from instrumentation Main bridge members mostly Supporting members/substructures hardly Geotech – not a thought (later calibration Tony Allen WSDOT)
")
7
Main Players Modjeski & Masters D’Appolonia – Geotech Baker – later Geotech Prof. Nowak – Michigan – statistics

8
FHWA – LRFD by October 2007 for bridges LRFD by October 2010 for walls, culverts, etc. Eventually left up to each state FHWA Phased in for various items

9
Importance now? Required Standard Specs no longer being updated as of about 2000 LRFD Spec is excellent reference source – especially geotechnical

10
Biggest problem states had in going LRFD – finding software
Biggest problem states had in going LRFD – finding software! This was impact to structural side, not geotech nearly as much.

11
Every VDOT Bridge Engineer who was at VDOT in Spring 2007 received following geotechnical guidance training from CO S & B Division.

12
LRFD Code Highlights Pertaining to Geotechnical Design

13
LRFD Code Highlights AASHTO LRFD Bridge Design Specifications
Section 3 for Loads and load factors Section 10 for Foundations Section 11 for Abutments, Piers, Walls Section 12 for Buried Structures

14
LRFD Code Highlights In general, LRFD made to match ASD for geotechnical design C , criticality of scour and economy of scour protection C3.4.1,expect sliding to control often for spread footings, as horizontal soil force is always maximized Scour is the leading cause of bridge failure in America. Don’t skimp on scour protection to save money.

15
LRFD Code Highlights 3.11, Earth Pressures (anchored wall pressure distribution change) Table , better exploration or field testing can increase resistance factor 10%-20% for shallow foundations RMR for bearing capacity preferred RMR is Rock Mass Rating System – LRFD code prefers this method to compute bearing capacity on rock, but it is not required.

16
LRFD Code Highlights Tables for driven pile resistance factors Need to do minimum of 3-4 PDAs on a job Can increase resistance factor 40% over PDA use if do static load test(s) ($$$) Be aware, you may need to increase your PDA (Pile Dynamic Test) test quantities over what you previously used.
 ($$$) Be aware, you may need to increase your PDA (Pile Dynamic Test) test quantities over what you previously used.")
17
Geotechnical Parameters
Geotechnical Parameters – Introduction and Guidance on Choosing Them 4 steps These slides will not be discussed in depth here in class. For students’ future use if so desired.

18
Geotechnical Parameters
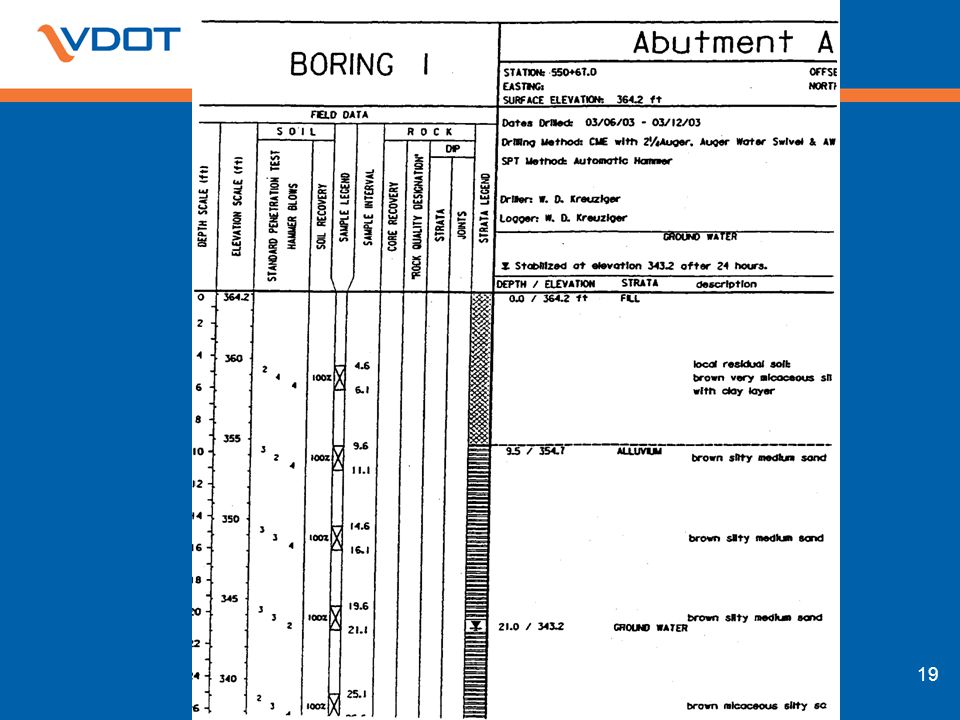
Step 1: Determine soil type 2 broad classifications of soil Granular (Gravel, Sand, Silt) Cohesive (Clay) The types are determined by sieve test Boring logs in bridge plans will show soil type
 Cohesive (Clay) The types are determined by sieve test. Boring logs in bridge plans will show soil type.")
20
Geotechnical Parameters
Step 2: Determine soil weight Standard correlations typically used to estimate unit weights Typically, assume saturated unit weight is pcf more than moist unit weight

21
These simple index charts are used by geotechnical engineers much more often than not.

22
Geotechnical Parameters
Step 3: Determine soil strength Look at boring logs for substructure If soil is granular (gravel, sand, silt) it will have a friction angle If soil is cohesive (clay, maybe clayey silt) it will have an undrained shear strength Clayey (sand, silt) may have both cohesion and friction angle
 it will have a friction angle. If soil is cohesive (clay, maybe clayey silt) it will have an undrained shear strength. Clayey (sand, silt) may have both cohesion and friction angle.")
24
Geotechnical Parameters
Step 3 (cont’d): Determine soil strength Determine either friction angle or shear strength from SPT corrected blow count N160, CPT data, lab test data SPT is most common by far In given column of boring logs, SPT blow counts are a set of 3 numbers – sum the last 2 of 3 to obtain N
: Determine soil strength. Determine either friction angle or shear strength from SPT corrected blow count N160, CPT data, lab test data. SPT is most common by far. In given column of boring logs, SPT blow counts are a set of 3 numbers – sum the last 2 of 3 to obtain N.")
25
Geotechnical Parameters

26
Geotechnical Parameters
Step 3 (cont’d): Determine soil strength If soil is granular, correct blow count per correction sheet: Po is effective vertical soil pressure at depth of N value N1 = CN*N (AASHTO ) Effective means use buoyant weight of soil (unit weight – 62.4 pcf) Only granular soils are corrected for overburden pressure, as for granular soils their strength depends on confinement.
: Determine soil strength. If soil is granular, correct blow count per correction sheet: Po is effective vertical soil pressure at depth of N value. N1 = CN*N (AASHTO ) Effective means use buoyant weight of soil (unit weight – 62.4 pcf) Only granular soils are corrected for overburden pressure, as for granular soils their strength depends on confinement.")
27
Geotechnical Parameters

28
Geotechnical Parameters
Further SPT N corrections: N60 = (ER/60%)*N (AASHTO ) N160 = CN*N60 (AASHTO ) ER = 60% for drop hammer ER = 80% for automatic hammer Unusual to correct for other items
*N (AASHTO ) N160 = CN*N60 (AASHTO ) ER = 60% for drop hammer. ER = 80% for automatic hammer. Unusual to correct for other items.")
29
Geotechnical Parameters
Step 3 (cont’d): Determine soil strength Determine friction angle for granular soils or shear strength for clays from testing (preferred) or standard correlations
: Determine soil strength. Determine friction angle for granular soils or shear strength for clays from testing (preferred) or standard correlations.")
30
Geotechnical Parameters

31
Geotechnical Parameters
Step 4: Determine soil settlement parameters Elastic modulus values of soil obtained by testing or correlations Tables in AASHTO Poisson’s Ratio Can use 0.3 for all non-saturated soils Use 0.5 for all saturated soils

32
Geotechnical Parameters
Rock Type of rock is shown on boring logs RQD is shown on boring logs Groundwater table shown on boring logs Need spacing and condition of joints Need point load or UC tests of rock Friction between concrete and rock is based on rock friction angle – obtain from tables – typically between 35 and 45

33
Geotechnical Parameters
Rock (cont’d) Obtain elastic modulus from AASHTO LRFD (Table C ) Obtain Poisson’s Ratio from AASHTO LRFD (Table C ) 0.2 is a good approximation
 Obtain elastic modulus from AASHTO LRFD (Table C ) Obtain Poisson’s Ratio from AASHTO LRFD (Table C ) 0.2 is a good approximation.")
35
Geotechnical Parameters
Exploration Follow Materials Division MOI Chapter III for number and depth of borings (same as AASHTO, except 20 ft under piles/shafts) Reckon depth of borings based on applied stresses and pile lengths Always sample at least 10-ft below EPTE and always core at least 10-ft of rock Good heuristic – bore 100-ft minimum
 Reckon depth of borings based on applied stresses and pile lengths. Always sample at least 10-ft below EPTE and always core at least 10-ft of rock. Good heuristic – bore 100-ft minimum.")
36
Geotechnical Parameters
Exploration (cont’d) Use drill rig to get SPT N values. Sample frequently within 2B of footing bottom Use split spoon to get disturbed soil samples for sieve analysis, Atterberg limits, corrosivity tests Get GROUNDWATER ELEVATIONS! Affects bearing, settlement, constructability, downdrag, corrosivity, earth pressures
 Use drill rig to get SPT N values. Sample frequently within 2B of footing bottom. Use split spoon to get disturbed soil samples for sieve analysis, Atterberg limits, corrosivity tests. Get GROUNDWATER ELEVATIONS! Affects bearing, settlement, constructability, downdrag, corrosivity, earth pressures.")
37
Pile capacities in ABLRFD
Example - Plan No Pile capacities in ABLRFD Generally, you will specify a strength axial capacity and a service axial capacity for a pile Service axial capacity will essentially be matched to ASD capacity The specified capacity is generally linked to the structural capacity of the pile – ensure geotechnical capacity is available

38
Example - Plan No. 285-84 Steel H-Piles End-bearing
Service Axial Capacity = 0.25*Fy*Area Corresponds to 9 ksi – same as ASD Advantage of 50 ksi steel can be counted on during driving, not for long-term static capacity Strength Axial Capacity = 0.60*Fy*Area Article – 0.60 is good driving conditions; 0.50 is severe conditions Corresponds to 21.6 ksi in good conditions Use of 36 ksi yield strength has a long history

39
Example - Plan No. 285-84 Steel H-Piles Friction
Service Axial Capacity = Ultimate Geotechnical Capacity / 3 Matches ASD Strength Axial Capacity = Ultimate Geotechnical Capacity / 2

40
Example - Plan No. 285-84 P/S Concrete Piles End-bearing
Service Axial Capacity – match to ASD value of about 1.44 ksi (0.33f’c – 0.27fpe, Article of ASD code); HOWEVER, VDOT practice is limit to ~0.80 ksi Strength Axial Capacity – use 0.70*f’c*Area (Article of LRFD code, simple compression bearing) The 0.80 ksi limit corresponds to about 60 tons on a 12” square p/s pile, and about 230 tons on a 24” square p/s pile – traditional upper limits at VDOT.
; HOWEVER, VDOT practice is limit to ~0.80 ksi. Strength Axial Capacity – use 0.70*f’c*Area (Article of LRFD code, simple compression bearing) The 0.80 ksi limit corresponds to about 60 tons on a 12 square p/s pile, and about 230 tons on a 24 square p/s pile – traditional upper limits at VDOT.")
41
Example - Plan No. 285-84 P/S Concrete Piles Friction
Service Axial Capacity = Ultimate Geotechnical Capacity / 3 Matches ASD Again, LIMIT to bearing stress of ~0.80 ksi Strength Axial Capacity = Ultimate Geotechnical Capacity / 2

42
VDOT MSE Wall Analysis Spreadsheet Overview
Plan No Example (Univ. Blvd. over 1-66, Prince William County) John Schuler, PE Senior Geotechnical Engineer Virginia DOT Structure & Bridge Division Spring 2007
 John Schuler, PE. Senior Geotechnical Engineer. Virginia DOT Structure & Bridge Division. Spring")
43
Example - Plan No. 285-18 – MSE Wingwalls
VDOT MSE Wall Spreadsheet Analyze & Iteratively Design MSE walls Objectives: Accurate User-friendly Transparent

44
Example - Plan No. 285-18 – MSE Wingwalls
Use the VDOT MSE Wall Spreadsheet External Stability (Bearing, Sliding, Eccentricity) Internal Stability for Steel Strips and Steel Grids Pullout, Tensile Strength, Connection Rupture
 Internal Stability for Steel Strips and Steel Grids. Pullout, Tensile Strength, Connection Rupture.")
50
Yellow cells are input (may show up as green on screen)
Yellow cells are input (may show up as green on screen). AASHTO says reinforcement length has to be at least 70% of wall height and all reinforcement layers must be of equal length.
. AASHTO says reinforcement length has to be at least 70% of wall height and all reinforcement layers must be of equal length.")
51
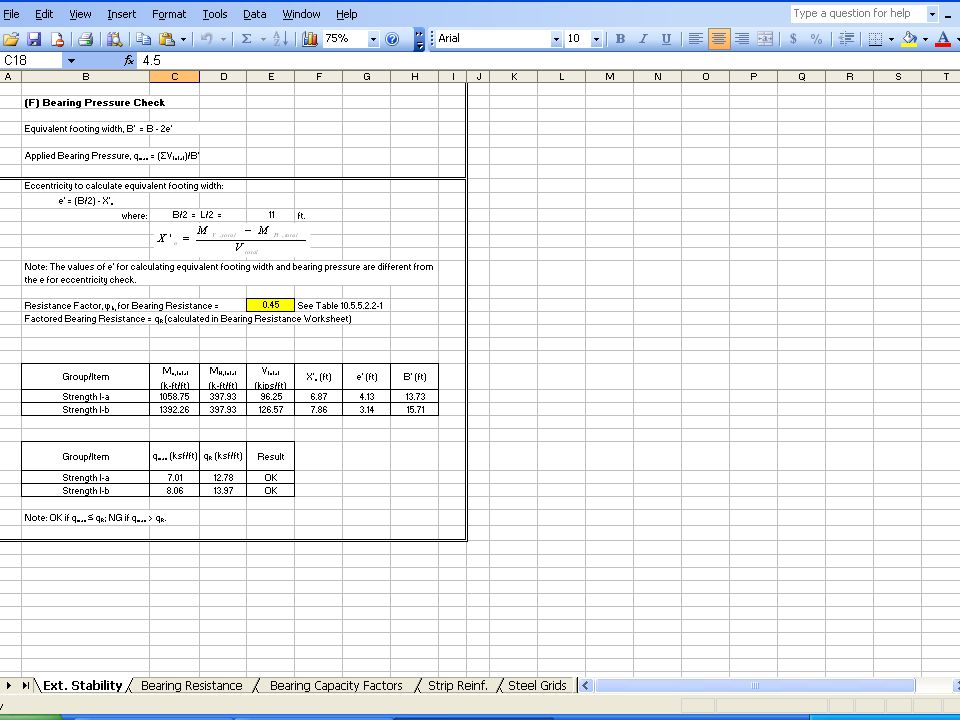
Only Str I Limit State really applies.

54
Example - Plan No. 285-18 – MSE Wingwalls
The 22-ft strip length works. This is 70% of wall height and is the minimum allowed by AASHTO. Now look at internal stability

55
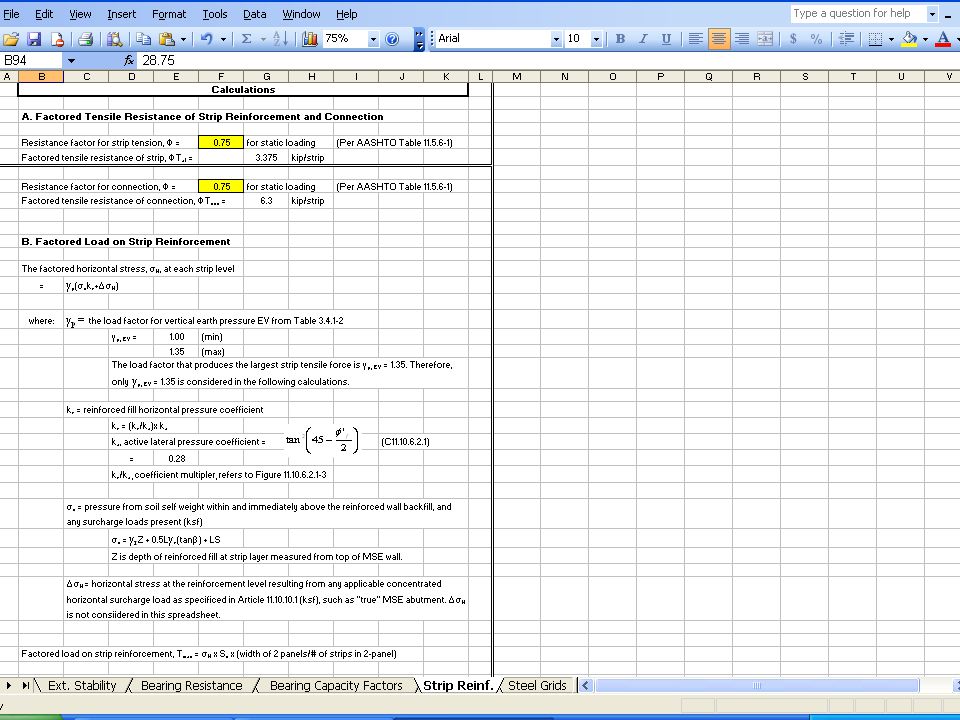
Change user inputs as appropriate
Change user inputs as appropriate. Strip dimension and strengths come from vendor. Only certain suppliers are approved for use on VDOT projects.

57
Again, yellow cells are input. Input as many rows as you call for
Again, yellow cells are input. Input as many rows as you call for. Calculations are checked at each row in this table for rupture strengths of strips and of connections to panels.

58
Pullout of strips is checked.

59
Example - Plan No. 285-18 – MSE Wingwalls
Strips with given input data work for pullout Strips don’t work for tensile strength or connection strength as input (just an example – use actual manufacturer data)
")
60
Example - Plan No. 285-18 – MSE Wingwalls
QUESTIONS? ¿PREGUNTAS? FRAGEN?

61
VDOT Anchored Wall Analysis Spreadsheet
Overview Example John Schuler, PE Senior Geotechnical Engineer Virginia DOT Structure & Bridge Division Spring 2007

62
Example – Anchored Wall
VDOT Anchored Wall Spreadsheet Analyze & Iteratively Design MSE walls Objectives: Accurate User-friendly Transparent

63
Example – Anchored Wall
Use the VDOT Anchored Wall Spreadsheet Checks wall/soldier pile bending Designs anchor length Checks anchor strength Designs soldier pile embedment – against rotation and vertical load Currently cannot be used for a cantilever sheeting wall Design and construction details are a little more detailed than for MSE walls.

64
Example problem

65
Main input cells – again in yellow. AASHTO references listed.

66
Earth pressure diagrams from AASHTO/FHWA Geotechnical Engineering Circular (GEC) 4. The pressure diagrams vary slightly for varying rows of anchors, hence the spreadsheet is broken up into worksheets for 1, 2, and up to 3 anchors.

67
Anchor loads are calculated here.

68
Total anchor length = anchor bond length + unbonded anchor length (this latter must extend from the wall face through the anticipated failure zone and for a minimum of 3 feet beyond that.

69
Wall element design checked here.

70
This table checks that the discrete vertical elements (typically a soldier pile embedded in a 3-ft diameter concrete caisson, about 8’ on centers) are embedded deep enough to provide rotational restraint against the active earth pressure behind the wall.
 are embedded deep enough to provide rotational restraint against the active earth pressure behind the wall.")
71
This input cell that allows user to vary how much vertical anchor component load transfers to the embedded portion of soldier pile below excavation level is important. There is no guidance in AASHTO on this, other than to assume a very, very conservative 100% is transferred.

72
This table checks the embedment of the soldier pile for bearing resistance against vertical loads.

73
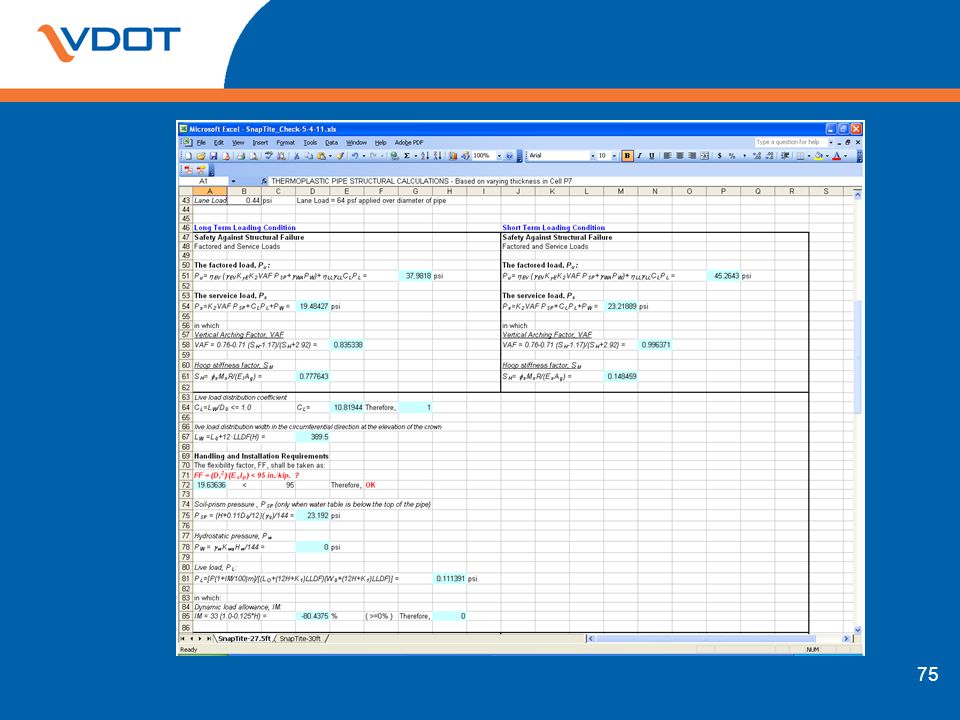
Materials developing plastic, metal, and concrete pipe LRFD design capability Plastic already on TeamSite

79
http://www. virginiadot. org/business/bridge-LRFD
VDOT Materials Geotechnical TeamSite

Similar presentations