Download presentation
Presentation is loading. Please wait.

1
Wayside Detection The Detroit Edison Experience
Dennis J. Buda Detroit Edison Railroad Engineering Program University of Illinois Urbana-Champaign, ILL December 2006

2
Discussion Topics The Detroit Edison Strategy WILD Issues
Financial Issues Conclusions and Recommendations

3
Introduction 36” Wheels Heavy Haul High Mileage Service
Comparison of DTE and AAR CRB Data 2002 and 2003 Data - CRB Limitations DTE - Michigan Publicly Traded Utility 2.1 Million Customers - $17.0 Billion Assets 7,000 Aluminum Rotary Railcars Average Car Mileage 100,000/Year Fuel Source from PRB and Appalachian Mines

4
Wheel Failures and WM Codes
WM 66, Flange Cracked or Broken WM 68, Cracked Rim WM 71, Shattered Rim WM 72, Spread Rim WM 83, Cracked Plate WM 75, Shelling, Spalling, Thermal-Mechanical WM 65 and 67, Out of Round (WILD or Gage) WM 76, Built-Up Tread WM 78, Slid Flat
 WM 76, Built-Up Tread. WM 78, Slid Flat.")
5
Recent AAR Rule Changes
WM 65 Wheel Impact Load Detector Removal at Impact Greater Than 90 Kips 97% of the Benefit Falls to Class I RR’s Rim Thickness Credit – Removed Window of Opportunity - Stress State

6
DTE vs. CRB Comparison Why Made Codes 66, 72, 74, 83
DTE = 0, AAR CRB = 4,197 total DTE = 0, AAR CRB = 4,841 total DTE = 1 shattered rim in 2002, 0 in 2003 AAR CRB = 174 in 2002, 143 in 2003 Chi-square was then used to determine if there is a statistically significant difference for various Why Made Codes…..

7
Chi-square Comparisons
There is a statistically significant difference in wheel removal performance for DTE vs. AAR CRB - DTE has fewer than expected removals for the following Why Made Codes: 65, 67, 75, 76, 78, This is true despite heavy haul, high mileage coal train operations….

8
The Detroit Edison Strategy
The Theory The WILD Program 50+ Kip Maintenance Strategy

9
The Theory The private car owner can effectively manage the life and performance of heavy haul-high mileage wheel sets, by developing a proactive maintenance strategy based upon way-side detection methodologies in combination with Class I Railroads, private railcar maintenance providers, and railway suppliers.

10
The WILD Program Data Purchased from TTCI By Train By Railcar
By Wheel Location By Graph Proactive Maintenance Strategy

11
WILD Data

15
90 70 50

16
50+ Kip Maintenance Strategy
Wheels Replaced Above 85 kips (3Pt. MA) 50+ Kips - Complete Visual Inspection Install Cobra Tread Guard Brake Shoes Computerized SCAT and Date Stencil Constant Contact Measurement
 50+ Kips - Complete Visual Inspection. Install Cobra Tread Guard Brake Shoes. Computerized SCAT and Date Stencil. Constant Contact Measurement.")
17
50+ Kip Maintenance Strategy
Brake Beam & Polymer Slides Springs & Truck Mechanisms Re-torque Bolts - Air Valve & Structural Inspect Relief on Bearing Adaptors AAR Condemnable Criteria (1/8 WM 64) Modified NCTA Wheel Specification
 Modified NCTA Wheel Specification.")
18
Wheel Life Trend Analysis
50+ Kip Strategy Began Nov. 2003 1,500 Mile Inspection on Western Class I 35 Trains Completed 33,600 Wheels YTD

19
Wheel Life Trend Analysis
Without 50+ Kip Strategy 01/01/03…11/14/03 80 Randomly Selected Wheel Sets With 50+ Kip Strategy 11/15/03…12/31/03 102 Randomly Selected Wheel Sets

23
days (avg.) 90 70 50
")
24
Targeted Considerations
Rail Maintenance Management Forum Continue Investigative Wheel Failure Analysis Equipment Health Monitoring TAG Component Performance Within AAR Rulings Railcar Capacity and Loading Criteria Break Even Point: Railroad vs. Private Shop WILD Site and Software Performance The PUR Owner Requires a Rule Making Vote

25
DTE Wheel Removals With Brake System Repairs
DTE wheel changes that also had a brake system repair within previous year Data for 1/03 to 7/04, Job Codes Analyzed 21,035 wheel changes - 1,738 also w/brake repair Air hose (1,182) Emergency portion (380) Service portion (125) Hand brake related (51)
 Emergency portion (380) Service portion (125) Hand brake related (51)")
26
Wheel Removals With Brake System Repairs
By Why Made Code (Data 1/03-7/04)
")
27
Wheel Removals With Brake System Repairs
By Why Made Code - 75, 65, 78, 67 (1/03-7/04)
")
28
2003 Removals with Brake Repairs Chi-Square Analysis
DTE 21,035 removals - 1,185 also with air brake system repair within previous year WM ,156 removals w/brake repair WM removals w/brake repair WM removals - 30 w/brake repair Compared WM 65, 75, 78 with brake repairs to all 2003 DTE removals with brake repairs - statistically significant difference - “Worse”

29
WILD Issues WILD Calibration: Frequency & Uniformity
Effects of Train Speed Effects of Track Structure & Sub-grade Effects of Concrete Ties WILD Reading Variation Etc.

30
Conclusions DTE Wheel Removals Wayside Detectors are Useful Tools
Better vs. AAR CRB for WM 65, 67, 75, 76, 78 Also Better Failure Performance Than AAR CRB Wayside Detectors are Useful Tools Variation is a Concern DTE 50+ Kip Strategy Lengthens Wheel Life Brake System Repairs Linked to Wheel Life WM 65, 67, 75 Appear to be Affected

31
Wild sites

32
Pareto of whymade since 2003

33
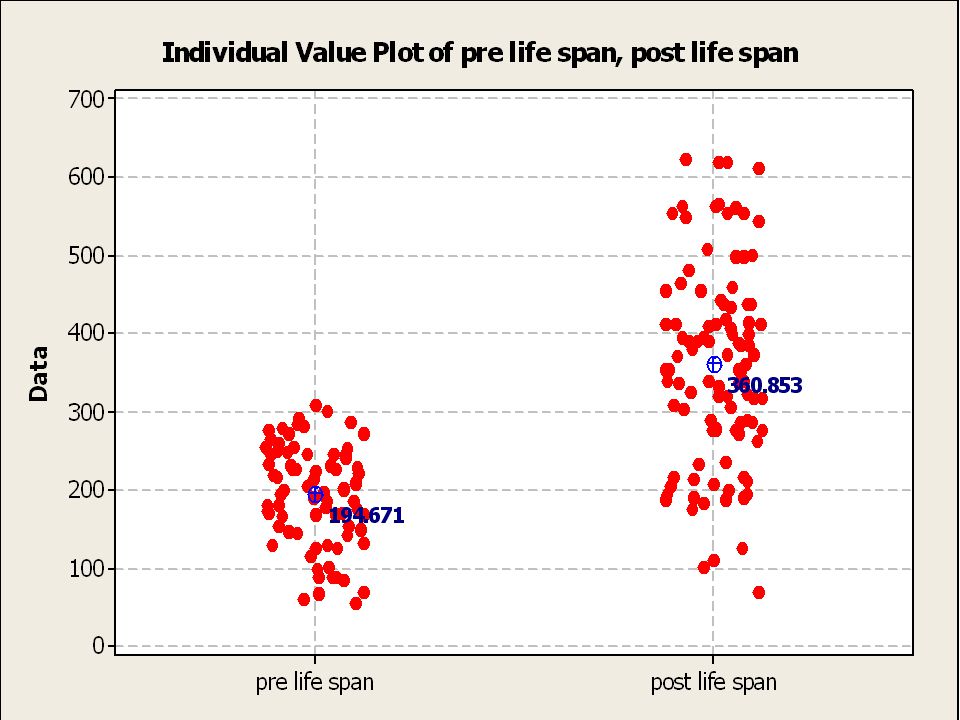
Life span since 2002

34
Whymade 65 life span

35
3 pt mavg & kips

36
Scatter plot of kips variation vs. train date

37
Grahical summary of sample pool

38
Distribution of kips variation

39
Hypothesis Kips variation vs. Speed change?
Kips variation vs. Car weight? Kips variation vs. Site change?

40
Kips vs. spd correlation

41
Kips vs. weight correlation

42
Scatter plot of kips var by site-comb

43
Observations Kips variation vs. Speed variation – small correlation.
Kips variation vs. Weight variation – none. Kips variation vs. different sites – small correlation.

44
MSA – precise & accurate

45
Scatter plot of kips var vs. train date

46
Graphical variation vs. upper and lower control limits

47
Measuring system variation vs. process tolerance

48
Measuring gage tolerance vs. Process tolerance example
Process Tolerance = +/- 7.5 kips, 70 – 85 kips. Measurement Tolerance is 1/10th of Process Tolerance, = +/-.75 kips.

49
Scatter plot of kips variation vs. train date

50
Financial Impact WM 65, 67 and WM 75 Wheel Changes 2002, 2003 and 2004
,279 Total - 1,769 ,179 Total - 2,179 ,013 Total - 2,005 AAR Labor Rates per wheel switch $1,000.00 Total Cost $1,769,000 Total Cost $2,179,000 Total Cost $2,005,000

51
Financial Impact Train days lost equals number of wheels pulled.
One train cycle equals seven days (52 cycles per train per year Total number of cycles lost (5 sets) 2003 – 311 (6 sets) 2004 – 286 (5.5 sets) At current lease rates ($500 pcpm), cost to Detroit Edison is approximately $3,600,000.00
 2003 – 311 (6 sets) 2004 – 286 (5.5 sets) At current lease rates ($500 pcpm), cost to Detroit Edison is approximately $3,600,")
52
Summary The 50+ Kip Strategy Extends Wheel Life.
WM65 Exhibits Shortest Life Span. What’s the contribution of variation by the measuring system? - What are the variation contributions from the Repeatability & Reproducibility tests of the measuring devices?

53
Recommendations Root Cause of Wheel Defects WM 65 & WM 75
Computerized SCAT at All Repair Tracks Rail Maintenance Management Forum WILD Calibration Should be Standardized and Meet AAR M-1003 Quality System Improved Efforts to Share Costs and Benefits Within the Railroad Industry Private Railcar Owner - Voting AAR Member

54
The Final Thought Our greatest challenge as an industry is to get the departments responsible for the vehicle performance and the track maintenance to work together and define a wheel rail interaction strategy to obtain synergy between the vehicles, track and the long term profitability of the heavy haul operation. Source: International Heavy Haul Association (2001)
")
Similar presentations


 Grants Chapter 6.>")
