Download presentation
Presentation is loading. Please wait.

1
Environmental Science
Graphing Basics Environmental Science

2
What is a graph? Graph – A visual representation of data There are three main types: Bar Graph Circle/Pie Graph Line Graph

3
Bar Graph Used to show comparison between quantitative data (numbers) and qualitative data (objects, places, etc)
 and qualitative data (objects, places, etc)")
4
Circle/pie graph Used to show percentages of a whole
Must add up to 100% 5 red, 5 blue, 10 green 5/20 x 100 = 25% red 5/20 x 100 = 25% blue 10/20 x 100 = 50% green

5
Line Graph Used to show relationships between quantities Show a change over time May have more than one line on a single graph

7
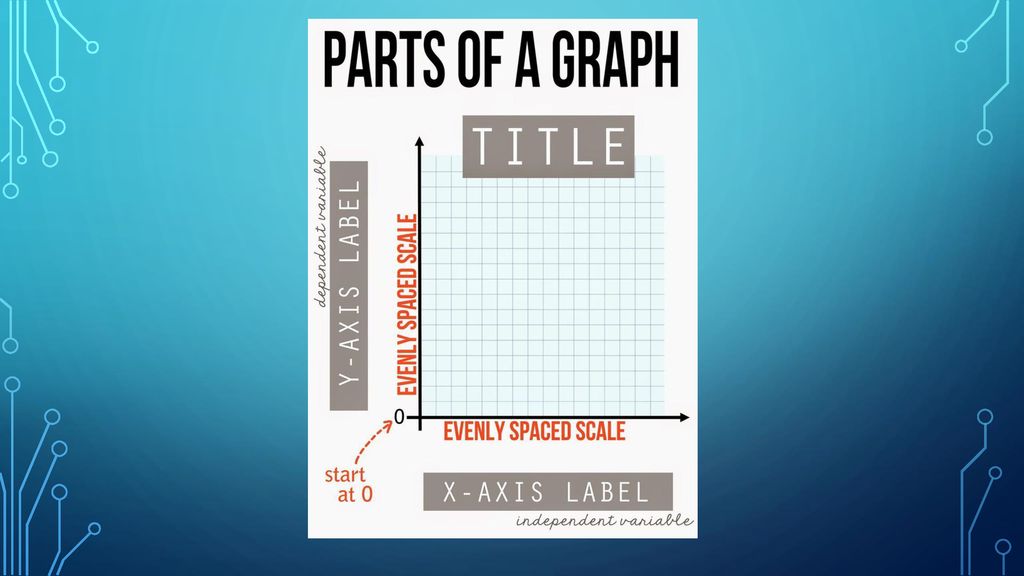
Steps to Making a graph Decide which type to used based on the data
Determine you independent and dependent variables Ind – x axis; dep – y axis Make your EVENLY SPACED scale to use as much of the graph paper as possible – Always start at zero! Plot points (line graph) or draw bars Make a key if necessary Give it a title and label your axes! (Points off if you don’t!)
 or draw bars. Make a key if necessary. Give it a title and label your axes! (Points off if you don’t!)")
Similar presentations


 to see trends Help to make conclusions easier Are.>")


 rate of goldfish. Identify the independent.>")


