Download presentation
Presentation is loading. Please wait.

1
Georgia Mathematics Conference October 18, 2012 Dianna Spence Gregg Velatini North Georgia College & State University This work supported by grants NSF DUE-0633264 and NSF DUE-1021584

2
Sample Learning Tasks Explorations Experiencing Statistics Concepts Projects Synthesizing and Applying Simulations: Establishing Reasoning behind Statistical Inference CCGPS Understand and evaluate random processes underlying statistical experiments Make inferences and justify conclusions from sample surveys, experiments, and observational studies

3
Teacher request: Please hold questions or ask them privately Population: All words in the Gettysburg Address Task: Obtain a representative sample from this population

4
Suggestions Compare student values for first random number Press arbitrary number of times to randomize BEFORE starting sample What about repeats? Same random number? Same word?

5
3 3.5 4 4.5 5 5.5 6 6.5 7 7.5 8 8.5 9 9.5

6
Scenarios Height Memorizing letters Key Ideas Variable Observation vs. Experiment Treatment Random Assignment Blind Treatment

7
Student tasks Identify research questions Define suitable variables, including how to quantify and measure variables Submit project proposal and obtain approval Collect data Design unbiased data collection method Address sampling issues Analyze and interpret data Write a report on methods and results Present research and findings to class

8
Student Guide Instructor Guide Technology Guide Appendices A – E: for students and instructors T1 – T3: for instructors Available online: http://faculty.northgeorgia.edu/DJSpence/NSF/materials.html

9
Sources of Data: 3 Categories Administer surveys Student constructs a survey and has people fill it out Find data on the Internet Physically go out and record data e.g., measure items, time events with a stopwatch, look at prices, look at nutrition labels

10
SEEKAVOIDEXAMPLES Neutrality o Bias in wording o Leading questions o Highly charged words Should the government waste money on unemployed bums? Do you support government spending on unemployment programs? Clarity o Confusing questions o Verbose questions o Poorly worded questions o Insufficient context/structure How many times have you assisted a classmate or friend with homework, papers, worksheets, or other school- related assignments? How many times in the last week have you helped a peer with school work? Precision o Ambiguous questions o Insufficient answer options Do you avoid sugar and caffeine, or do you consume both? Do you limit sugar intake? Do you limit caffeine intake? Accuracy o Estimates and guesses o Information not easily recalled On average, how many hours a night do you sleep? How many total hours have you slept over the last 3 days?

11
Whats wrong with these? What religion are you? (circle one) Methodist Baptist Catholic Muslim Jewish On a scale of 1 to 10, how stressed are you?
 Methodist Baptist Catholic Muslim Jewish On a scale of 1 to 10, how stressed are you .")
12
A construct to measure stress Please mark each statement that is true about you. __If I could stop worrying so much, I could accomplish a lot more. __Currently, I have a high level of stress. __In this point in my life I often feel like I am overwhelmed. __I have a lot to do, but I just feel like I cant get ahead or even sometimes keep up. __I often worry that things wont turn out like they should. __I have so much going on right now, sometimes I just feel like I want to scream. Score 1 for each checked box. Range is 0 to 6, with higher numbers indicating higher levels of stress.

13
Some considerations: Consider using scales/constructs e.g., Appendices B,C Maintain confidentiality Use anonymous surveys for sensitive data

14
Internet Data Sources I. Government/Community Census Bureau: http://www.census.gov/ http://www.census.gov/ Bureau of Justice Statistics: http://bjs.ojp.usdoj.gov/index.cfm?ty=daa http://bjs.ojp.usdoj.gov/index.cfm?ty=daa City Data Site: http://www.city-data.com/ http://www.city-data.com/ State and county statistics sites State and national Dept.s of Education County tax assessment records

15
Internet Data Sources II. Restaurants: Nutrition Info Applebees Nutrition Guide Arby's Nutrition Guide Burger King Nutrition Guide IHOP Nutrition Guide KFC Nutrition Guide Longhorn Nutrition Guide McDonald's Nutrition Guide Olive Garden Nutrition Guide Ruby Tuesday's Nutrition Guide Subway Nutrition Guide Taco Bell Nutrition Guide Google YOUR favorite place to eat!

16
Internet Data Sources III. Sports Data Sports Statistics Data Resources (Gateway) http://www.amstat.org/sections/SIS/Sports Data Resources/ http://www.amstat.org/sections/SIS/Sports Data Resources/ General Sports Reference Site www.sports-reference.com www.sports-reference.com NFL Historical Stats: http://www.nfl.com/history http://www.nfl.com/history Individual team sites
 Data Resources/ Data Resources/ General Sports Reference Site NFL Historical Stats: Individual team sites.")
17
Internet Data Sources IV. Retail/Consumer (General) Cost/Prices e.g., Kelley Blue Book: http://www.kbb.com/ http://www.kbb.com/ Consumer Report ratings. http://www.consumerreports.org/cro/index.htm http://www.consumerreports.org/cro/index.htm Product Specifications e.g., size measurements, time/speed measurements, MPG for cars
 Cost/Prices e.g., Kelley Blue Book: Consumer Report ratings. Product Specifications e.g., size measurements, time/speed measurements, MPG for cars.")
18
Matched Pairs t-Test: 2-tailed: H a predicting that on average, students rating of Coke and Pepsi would be different. t statistic =2.62 P value= 0.0116 (2-tailed) Conclusion: Evidence that on average, students rated the two drinks differently (Coke was rated higher) Participant Coke Pepsi #1 89 #2 7 5...
 Conclusion: Evidence that on average, students rated the two drinks differently (Coke was rated higher) Participant Coke Pepsi #1 89 #")
19
t-Test for 2 independent samples: 1-tailed: H a predicting that on average fruit drinks have higher sugar content per ounce than fruit juices t statistic = -0.14 P value= 0.5555 Conclusion: Sample data did not support H a. No evidence that on average, fruit drinks have more sugar than fruit juices.

20
t-Test for 2 independent samples: 1-tailed: H a predicting that in local state parks, oak trees have greater circumference than pine trees on average t statistic = 4.78 P value= 7.91 x 10 –6 Conclusion: Strong evidence that in local state parks oak trees are bigger than pine trees on average. Lurking variable identified and discussed: age of trees (and possible reasons that oak trees were older)
.")
21
Sample Student Projects Matched Pairs t-Test : 1-tailed: H a predicting on average, Wal-Mart prices would be lower than Target prices for identical items t statistic =.4429 P value= 0.3294 Conclusion: Mean price difference not significant; insufficient evidence that Wal-Mart prices are lower. Item WalMart Target 64-oz. Motts Juice 2.79 2.89 12-oz LeSeur Peas 1.19 1.08...

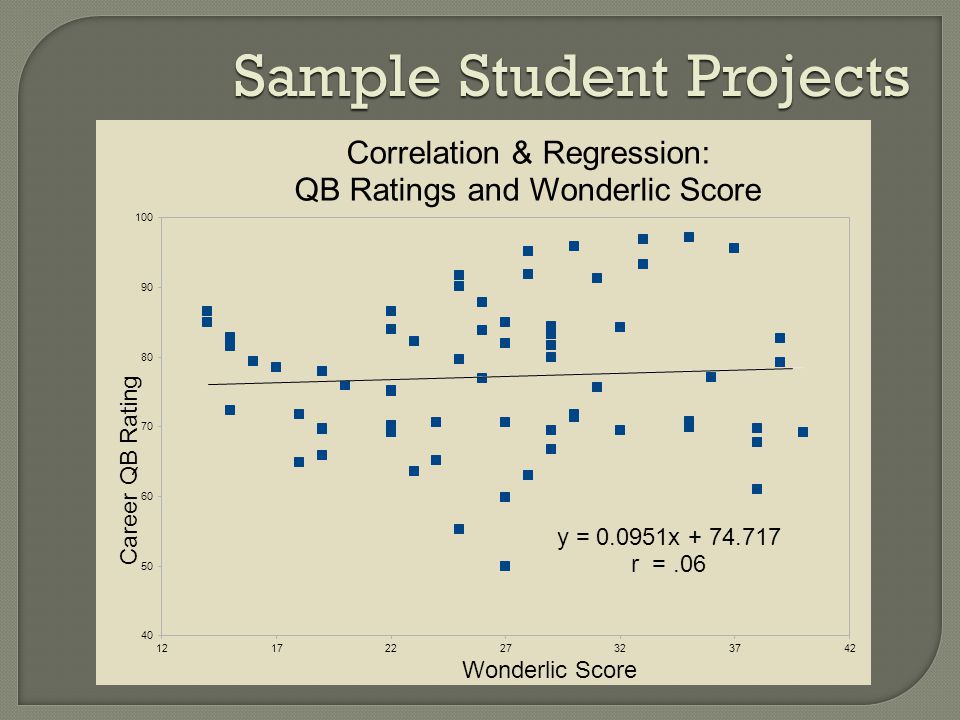
22
Sample Student Projects

26
Weight of projects Scoring rubrics Advantages – consistency, manageability, communication of expectations See Appendix T3 Team member grades Accountability of individual members

27
Activities courtesy of materials by Rossman & Chance; see Rossman, Introducing Concepts of Statistical InferenceIntroducing Concepts of Statistical Inference Scenario #1: Babies reactions to mean and nice toys http://statweb.calpoly.edu/bchance/applets/BinomDist3/BinomDist.html http://statweb.calpoly.edu/bchance/applets/BinomDist3/BinomDist.html

28
Activities courtesy of materials by Rossman & Chance; see Rossman, Introducing Concepts of Statistical InferenceIntroducing Concepts of Statistical Inference Scenario #2: Dolphin therapy for depression http://www.rossmanchance.com/applets/Dolphins/Dolphins.html http://www.rossmanchance.com/applets/Dolphins/Dolphins.html

Similar presentations


 Kari Lock Morgan STA 790: Teaching Statistics 9/19/12.>")
 CCSS Then/Now New Vocabulary Key Concept: Symmetric and Skewed Distributions Example 1:>")


