Download presentation
Presentation is loading. Please wait.

1
U.S. Census Bureau Foreign Trade Division
Understanding & Using Foreign Trade Statistics June 26, 2012

2
U.S. Census Bureau Welcome! Ryan Fescina Glenn Barresse
Chief, Methods Research & Chief, Special Projects Branch Quality Assurance Branch (301) (301)
 (301)")
3
U.S. Census Bureau Overview & Export Specific Information
Lindsay Kuberka Commodity Analysis Branch

4
What do the statistics measure?
The physical movement of goods between: United States, Puerto Rico, U.S. Virgin Islands Foreign countries.

5
What’s not Covered in Statistics?
Monetary gold U.S. government to U.S. government Imports of articles repaired under warranty Intangibles Personal and household effects Low valued transactions

6
The Harmonized System (HS)
Harmonized Tariff Schedule of the U.S. Annotated for Statistical Reporting Purposes (HTSUSA) Statistical Classification of Domestic and Foreign Commodities Exported from the U.S. (Schedule B)
 Statistical Classification of Domestic and Foreign Commodities Exported from the U.S. (Schedule B)")
7
The HS System 17,000+ HTSUSA & 8,000+ Schedule B codes
Periodically revised Structure: 2 digit Chapter 4 digit Heading 6 digit sub heading 8 digit legal 10 digit statistical

8
The HS System

9
What is the difference? Export codes (Schedule B) are maintained by the U.S. Census Bureau. Import codes are administered by the U.S. International Trade Commission (USITC). Import Codes CAN be used to classify Exports, but Exports codes CAN NOT be used to classify goods for import (Imports has a lot more detail!!)
 are maintained by the U.S. Census Bureau. Import codes are administered by the U.S. International Trade Commission (USITC). Import Codes CAN be used to classify Exports, but Exports codes CAN NOT be used to classify goods for import (Imports has a lot more detail!!)")
10
Changes to the HTSUSA & Schedule B
Changes occur three different ways: WCO changes affect the HS (4 or 6 digit) level Legislation – affects the legal (8-digit) level Imports only 484(f) committee – affects the statistical (10-digit) level USITC, Commerce, Customs and Border Protection (CBP)
 level. Legislation – affects the legal (8-digit) level. Imports only. 484(f) committee – affects the statistical (10-digit) level. USITC, Commerce, Customs and Border Protection (CBP)")
11
Related vs. Non-related
Statistics cover the physical movement of goods, regardless of if item is sold When a U.S. manufacturer exports merchandise to their company in France or to a non-related purchaser in Russia, both are counted as trade

12
Export Specific Information

13
Valuation F.A.S. Export Value (free alongside ship)
Value of export at port based on transaction price, including inland freight, insurance other charges incurred (before loaded) Excludes international freight, cost of loading merchandise and any other charges/costs beyond port of export
 Excludes international freight, cost of loading merchandise and any other charges/costs beyond port of export.")
14
Leases If merchandise exported for <12 months
Non-statistical Leases > 12 months are statistical Consignment - Temp. lease with option to buy Statistical Examples: artwork or aircraft

15
Repairs – Exports Exporting items for repair
Report Ch HS number of item Non-statistical AES export information code TE (temporary export for repair) Exporting items repaired in U.S. Report HS 9801 and value of repair Report Ch HS number for replacements. Statistical
 Exporting items repaired in U.S. Report HS 9801 and value of repair. Report Ch HS number for replacements. Statistical.")
16
Import Specific Information
Matthew Frates Commodity Analysis Branch

17
Topics Valuation Country Sub Code (CSC) Special Provisions
Rate Provision Codes (RP) Repairs
 Repairs.")
18
Valuation Customs Value Generally, price actually paid excluding:
Duties Freight Insurance and other charges Relationship b/w parties should not influence value

19
Valuation (cont.) CIF (cost, insurance, freight)
CIF = Customs Value + Import Charges Excludes U.S. import duties

20
Valuation (cont.) Dutiable Value
Customs value of foreign goods subject to duty Where merchandise is a combination of U.S. and foreign goods, duty is applied only to the foreign value

21
Valuation (cont.) To determine the dutiable value of a combination of U.S. and foreign goods: Example: 9802 provision U.S. value is included in statistics Value is total of domestic + foreign values U.S. Goods indicators show that a portion of the import is domestic materials Publication IM146A

22
Valuation (cont.) Duty Collected by CBP
FTD generally uses duty as reported to CBP

23
Country Sub-Codes (CSC)
Indicates a special program allowing for free or reduced duty Examples: GSP, US-Chile Free Trade Agreement, NAFTA CSC used: 00 = no special programs claimed CA = Goods marked for Canada (NAFTA) MX = Goods marked for Mexico (NAFTA) Full list available on our website
 MX = Goods marked for Mexico (NAFTA) Full list available on our website.")
24
Special Provisions Chapter 98 & 99 for National use
Ch 98 - duty free/reduction Ch legislation, executive and administrative actions

25
Special Provisions (cont.)
U.S. goods exported and returned not advanced or improved U.S. origin Previously exported from U.S.

26
Special Provisions (cont.)
9802 – Goods with components of U.S. origin U.S. goods assembled abroad Importers deduct value of U.S. goods from total Customs value

27
Special Provisions (cont.) Dual Reporting of Codes
Report 10-digit statistical reporting number Chapter 1-97 Unit of quantity and value Followed by special provision Chapter 98

28
Special Provisions (cont.) Dual Reporting of Codes
Prototypes for development, testing, evaluation Free Dishwasher, household 2.4% Dishwasher, other

29
Special Provisions (cont.)
Chapter 99 Quotas Additional duties Temporary reductions

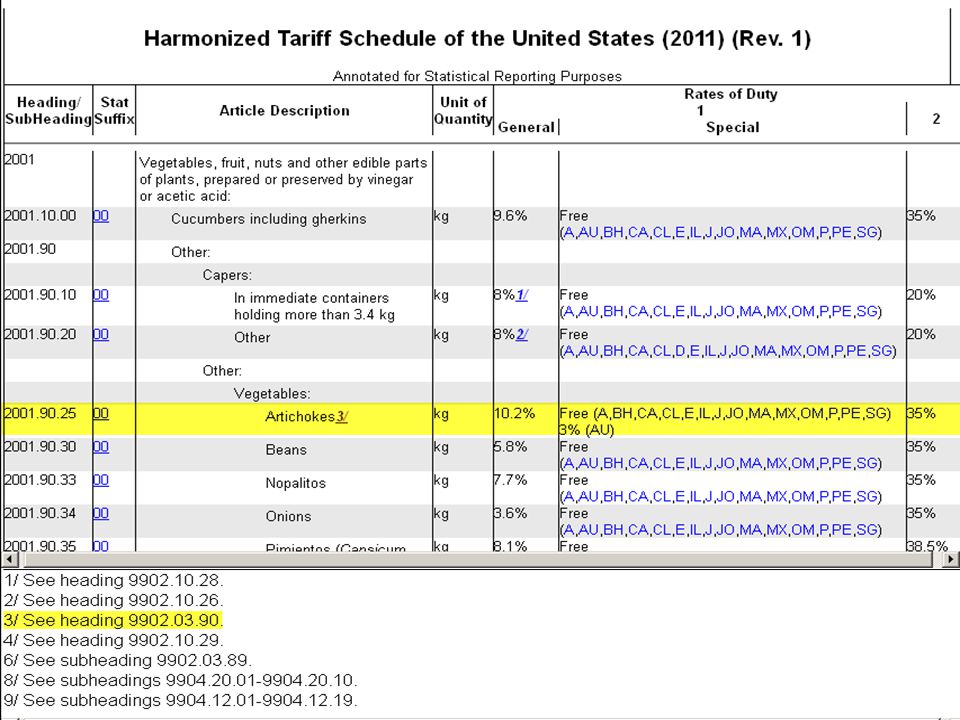
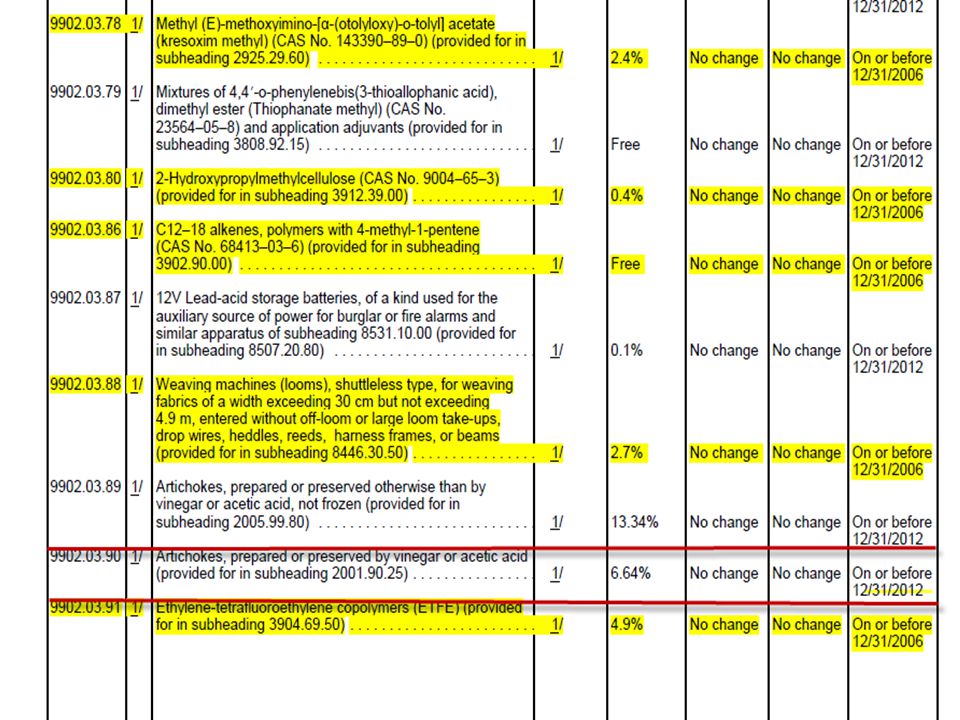
32
Special Provisions (cont.) Dual Reporting of Codes
Footnote 3 - See headings Reduced or duty free rates Artichokes Report –

33
Rate Provision (RP) codes
RP codes indicate free or dutiable status Every line item is assigned a RP code RP code can relate back to Ch. 98 or 99 Assigned by FTD

34
Rate Provisions (cont.)
Examples of RP codes: RP 17 = Free as articles imported for the handicapped. Imported under HTS subheadings , & RP 69 = Dutiable at rate prescribed in Rate of Duty columns of HTS Ch Duty reported Full list available on our website

35
Repairs – Imports Importing repaired item Importing item for repair
Report Ch. 98 number and value of repair If under warranty – non-statistical If Non-warranty – statistical Also report Ch HS in order to determine duty Importing item for repair Temporary imports – non statistical

36
Internet References FTD Guide to Foreign Trade Statistics
Guide to Foreign Trade Statistics

37
Internet References (cont.)
Schedule B HTSUSA

38
Internet References (cont.)
CSC RP

39
Any Questions?

40
Data Collection Coordination Branch
U.S. Census Bureau Sources of Data Wendy D Peebles Data Collection Coordination Branch

41
Topics Coverage Bonded Warehouses Foreign Trade Zones (FTZs)
Sources of Import Data Import Data Categories Sources of Export Data Export Data Categories Kimberley Process (KP)
")
42
Coverage Movement of goods into & out of: U.S. Customs Territory
U.S. Virgin Islands Bonded Warehouses Foreign Trade Zones (FTZs)
")
43
Coverage (cont.) Goods not included: U.S. trade with U.S. territories
Trade between U.S. territories Trade between foreign countries and U.S. territories (other than Puerto Rico and Virgin Islands) In transit merchandise through the U.S.
 In transit merchandise through the U.S.")
44
Bonded Warehouses Authorized by U.S. Customs
Payment of duties on goods are deferred until goods are moved into Customs territories No duties if reshipped to foreign country

45
Foreign Trade Zones A Foreign Trade Zone – is a restricted access site in or adjacent to a U.S. Customs port of entry Two Types: General Purpose Subzones Within zones, merchandise can be assembled, manufactured, repackaged, destroyed Educational Mediums – Blogs, Newsletter, Videos, Frequently Asked Questions

46
Foreign Trade Zones (FTZs)
Operated as public utilities under the control of U.S. Customs Goods are subject to duties if sent into Customs territory No duties if reshipped to foreign country

47
Foreign Trade Zones (FTZs) (cont.)
Non-Privileged Foreign (NPF) Status—duties are based on the condition of the goods when it exits the zone Privileged Foreign (PF) Status—duties are based on the condition of the goods when it first enters the zone
 Status—duties are based on the condition of the goods when it exits the zone. Privileged Foreign (PF) Status—duties are based on the condition of the goods when it first enters the zone.")
48
Sources of Import Data Paper (Puerto Rico Staff) Electronic
Entry Summaries (CBP Form-7501) (ACS) ABI Entries (CBP Form-7501) Vessel Repairs (CBP Form-226) No electronic equivalent Foreign Trade Zones Admissions (CBP Form-214A) CBP E-214
 (ACS) ABI Entries. (CBP Form-7501) Vessel Repairs. (CBP Form-226) No electronic. equivalent. Foreign Trade Zones. Admissions. (CBP Form-214A) CBP E-214.")
49
Sources of Import Data (cont.)
March 2012 data

50
Sources of Import Data (cont.)
March 2012 data

51
Import Data Categories
General Imports Imports for Consumption Warehouse Entries or FTZ Admission 2. Imports for Consumption Imports for Consumption Warehouse or FTZ Withdrawals

52
Import Data Categories (cont.)
General Imports – measure the total physical arrivals of merchandise from foreign countries Entering consumption channels immediately Bonded warehouses or FTZs admissions

53
Import Data Categories (cont.)
Imports for Consumption – measure the total merchandise that has physically cleared through Customs Entering consumption channels immediately Withdrawal for consumption from bonded warehouses or FTZ

54
Import Data Categories (cont.)
Goods processed in a FTZ Example: Petroleum entered in FTZ General import statistics would show Ch 27 when goods admitted to FTZ Petroleum is processed in the zone, creating byproducts Gasoline, Kerosene and Jet Fuel Therefore imports for consumption are based on what EXITS the zone, showing gasoline, Kerosene, and Jet Fuel.

55
Automated Export System Canadian Data Exchange
Sources of Export Data Electronic Automated Export System (AES) Canadian Data Exchange
 Canadian Data Exchange.")
56
Sources of Export Data (cont.)
March 2012 data

57
Sources of Export Data (cont.)
March 2012 data

58
Export Data Categories
Domestic Exports Foreign Exports (Re-exports) Noncontiguous Exports
 Noncontiguous Exports.")
59
Export Data Categories (cont.)
Domestic Exports Merchandise grown, produced, or manufactured in the U.S. Foreign origin merchandise that has been changed from the form in which it was originally imported

60
Export Data Categories (cont.)
Foreign Exports (Re-exports) Foreign origin merchandise that has entered the U.S. for consumption At the time of exportation, the condition of the merchandise is the same as it was when imported
 Foreign origin merchandise that has entered the U.S. for consumption. At the time of exportation, the condition of the merchandise is the same as it was when imported.")
61
Export Data Categories (cont.)
Noncontiguous Exports Puerto Rico and Virgin Island trade with the U.S. Separate data product

62
Kimberley Process (KP)
A joint initiative to stem the flow of conflict diamonds. Minimum requirements for its members Forgery-resistant certificate Tamper-proof packaging Trade with other KP Participants

63
Kimberley Process (KP) (cont.)
Clean Diamond Trade Act Participating Countries HTSUSA/Schedule B Number

64
Kimberley Process (KP) (cont.)
Imports must be entered by formal entry regardless of value Exports must be filed in AES regardless of value Export validation - confirmation

65
Kimberley Process (KP) (cont.)
 (cont.)")
66
Kimberley Process (KP) (cont.)
 (cont.)")
67
Working Group on Statistics
Carolyn Francis – Chair of the Working Group of Statistics Contact: or Responsible for Reconciliation of Data Conferences Intercessional Plenary

68
Kimberley Process (KP) (cont.)
Resources (KP Rough Diamond Statistics) (State Department Conflict Diamonds) (Main Kimberley Process) (U.S. Kimberley Process Authority)
 (State Department Conflict Diamonds) (Main Kimberley Process) (U.S. Kimberley Process Authority)")
69
Data Collection Coordination Branch
Questions! (301)
")
70
Processing and Editing; ACE portal
June 26, 2012 Andrew Chang Methods Research and Quality Assurance

71
Topics Processing/Editing ACE Portal Prepare for editing Editing
Resolve errors ACE Portal

72
Processing Editing at Point of Collection
Alerts the filer of any discrepancies. Joint effort to maintain edits by the Census Bureau and CBP. Immediate feedback. Allows filers to respond to errors.

73
Processing Combine sources Reformat data to uniform structure.
Additional Non-statistical transactions are identified. Shipments to the U.S. Armed Forces Personal household goods Low value records.

74
Processing Statistical time periods Statistical month Carryover
Imports - Release date Exports - Clearance date Carryover Future month

75
Processing Preliminary Alterations
Recode or convert commodities as necessary. Quantity conversion lbs. to kg.

76
Processing Apply Corrections to Data
Corrections can be submitted by filer after the data are accepted. Example: Filer mistakenly placed $1 million in the value field and then reported a correction for that field of $100 thousand Corrections can be submitted by filer after the data are edited.

77
Editing Overview Code Validations Relationship Edits

78
Editing Code Validations Examples of fields we validate codes for
Harmonized System commodity. Country of origin. Foreign port. U.S. port. Special Program Indicators (imports). Etc…
. Etc…")
79
Editing Relationship Edits Ratio Range Examples

80
Editing Relationship Edits - Ratio Edits
Verify numeric data by computing ratios Several types of ratio edits Value to quantity Quantity to shipping weight or value to shipping weight First quantity to second quantity for shipments requiring two quantities

81
Editing Relationship Edits - Range Edits
Ratio edits alone cannot identify all errors, range edits are used to validate data. [min,max] Shipping weight exceeds what the mode of transportation can carry Example: 1,400,000 kg shipped via air is impossible

82
Editing Relationship Edits Examples: Unit price example – Fireworks
160 kg of fireworks valued at $40,000 Unit price= $250/kg Acceptable range for ratio in our edit [$2.20/kg,$220.45/kg] This shipment fails the edit.

83
Editing Relationship Edits Other Examples:
Commodity Specific Range Edits. Focus on each individual commodity Example: 20 kg of diamonds unlikely Country of origin. Improbable Country Example: Bananas from Greenland

84
Editing Commodity Specific Parameters 2.5 million parameters
17,000+ Import commodity codes 8,000+ Export commodity codes ≈100 edit parameters per commodity Parameters are flexible to change

85
Error Resolution Methods of Error Resolution. Imputation.
Automated program to determine eligibility for imputation Does not impute records of high impact Analyst review.

86
Error Resolution Imputation
Substitution or replacement of some value for a data point based on auxiliary information. Edit will typically impute the quantity or shipping weight.

87
Error Resolution Imputation Fireworks example
160 kg of fireworks valued at $40,000 Unit price= $250/kg Acceptable range for ratio in our edit [$2.20/kg,$220.45/kg] Impute quantity to kg based on factor Unit price= $38.11/kg

88
Error Resolution Analyst review Contact the filer Bypass the edits
Confirm correct classification, values, shipping weight, quantities and others fields. Bypass the edits

89
Error Resolution Analyst Review
Aggregate data by commodity to determine if total values and quantities are reasonable Compare measures to previous months – look for missing or misreported data and identify processing problems

90
Any questions before I move on to the ACE portal?

91
ACE Portal Automated Commercial Environment (ACE) is a U.S. Trade processing system designed to consolidate and automate border processing while facilitating legitimate trade. What is the ACE portal? ACE Portal is an interactive online tool that provides a user friendly gateway to access Customs information via the web.
 is a U.S. Trade processing system designed to consolidate and automate border processing while facilitating legitimate trade. What is the ACE portal ACE Portal is an interactive online tool that provides a user friendly gateway to access Customs information via the web.")
92
ACE Portal Differences in the data.
Data users see different data when comparing Census published data vs. ACE portal data. ACE will not see Census Bureau specific data.

93
ACE Portal Differences in the data
Editing and imputing data occur after the data are extracted from the source. ACE is not bidirectional. Non-statistical data are not published in Census data.

94
ACE Portal Differences in the data.
Census published data categorizes data by Entry Types: General Imports. Imports for Consumption . The ACE Portal will contain all entry types. Double counting trade into and out of warehouses and Foreign Trade Zones.

95
ACE Portal Differences in the data. Time periods
Census Published data classifies data by Statistical month. Carryover data are processed in current month then correctly allocated in yearly revisions. Future month-held until the appropriate processing month. ACE classifies by date.

96
Data Processing and Editing
Questions! (301)
")
97
United States – Canada Data Exchange
The United States – Canada Data Exchange Eboné Norman Process Coordination Staff U.S. Census Bureau June 26, 2012

98
What is the United States – Canada Data Exchange?
Agreement between the governments of the United States and Canada based on a Memorandum of Understanding (MOU)
")
99
Who is Involved? UNITED STATES • U.S. Census Bureau (Census)
• U.S. Customs & Border Protection (CBP) CANADA • Statistics Canada (STC) • Canada Border Services Agency (CBSA)
 CANADA. • Statistics Canada (STC) • Canada Border Services Agency (CBSA)")
100
How Does It Work? U.S. Exports to Canada = Canadian Imports from the U.S. and Canadian Exports to the U.S. = U.S. Imports from Canada

101
Why Was It Created? Benefits: Export Declarations
• Rise in Export under coverage Benefits: • Decrease operating costs to process Export Declarations • Eliminate reporting burden of Exporters • Location and language of both countries

102
U.S. and Canada Major Trading Partners
• Approx.14-15% of Total Imports Value from Canada • Approx.19-20% of Total Exports Value to Canada • Approx % of Total Imports Value from U.S. • Approx.71-72% of Total Exports Value to U.S.

103
What Are Some Differences in the Data Exchange?
• HS Recodes • Vendor vs. Exporter

104
How Do We Receive Canadian Import Data?
• STC Transmits files twice per month • Adjustments are required

105
What Kind of Adjustments?
• Freight Charges • Currency Conversion • Exports of Foreign Goods to Canada • Exports of U.S. Goods to Canada from Third Party Countries • Revisions

106
Freight Charges • Included in U.S. Exports
• Excluded in Canadian Imports • Added to compensate for difference in valuation

107
Currency Conversion monthly exchange rate
• U.S. Federal Reserve’s monthly exchange rate • STC converts to U.S. dollars/Foreign Trade Division (FTD) converts to Canadian dollars • Files are transmitted
 converts to Canadian dollars. • Files are transmitted.")
108
Exports of Foreign Goods to Canada
• Transmitted from STC ….Purchase Italian Shoes Sell Shoes to Canadian Store U.S: Foreign Export to Canada Canada: Import from Italy • FTD includes these goods in U.S. export statistics to Canada

109
Exports of U.S. Goods to Canada from Third Party Countries
• Transmitted from STC ….Sell American Clothes to Spain Sell Clothes to Canadian Store U.S: Domestic Export to Spain Canada: Import from U.S. (Spain 3rd Party) • FTD excludes these goods from U.S. export statistics to Canada
 • FTD excludes these goods from U.S. export statistics to Canada.")
110
Revisions • Estimates for Late Arrivals • Corrections from STC
• Corrections Made by FTD

111
Estimates for Late Arrivals
• STC sends with second transmittal • Estimates replaced with actual values the following month in the FT-900 press release only

112
Corrections from STC • Corrections to data sent in first transmittal
• STC sends with second transmittal • Corrections to data sent in first transmittal • Prior Month Corrections

113
Corrections Made By Census
• Commodity analysts verify corrections with their STC counterparts • Corrections made prior to publication, when possible

114
??? Questions ??? Eboné Norman

115
Diane Oberg June 26, 2012 diane.c.oberg@census.gov
Partner Country Diane Oberg June 26, 2012

116
Topics Definition of Partner Country Special Cases
Trade Statistics do NOT Follow the Money Why Bilateral Statistics Differ Partner Country Reconciliation

117
Partner Country U.N. Concepts & Definitions
Exports – Country of Ultimate Destination as known at time of export Includes: Exports of domestic merchandise Re-exports of foreign merchandise

118
Partner Country Imports – Country of Origin
Where grown, mined or manufactured Where last “substantially transformed” Multi-country production – attributed to single country of origin Legal Definition – tariffs, quotas, preferences CROSS – Customs Rulings Online Search System

119
Imports from Country A Include Goods produced in and exported from A
Goods produced in A incorporating foreign components if “substantially transformed” under U.S. Rules Goods produced in A by affiliates of U.S. or foreign firms Used goods – still classed by country of origin

120
Imports from Country A Need NOT have been exported from A
A sells to distributor in B, who exports to C A: export to B B*: import from A; export to C C: Import from A A exports used U.S.-built aircraft to B B*: import from United States *Not substantially transformed in B

121
Example -Imports from Canada
Need not have been exported from Canada Canadian wiring harnesses assembled in Mexico Then exported to United States

122
Trade Statistics Do NOT Follow the Money
Goods manufactured in A under contract to firm from country B: country of origin = A Firm in B purchases U.S. goods & directs shipment to A U.S: Export to A A: Import from U.S. A country may not be involved in another country’s imports from it (e.g. used goods, distribution)
")
123
Special Cases Re-imports – reported under HS 9801 – imports from country of shipment Country of origin undetermined – imports from country of shipment

124
Transiting Goods U.N. Guidelines – exclude in-transit goods from statistics Shipper may choose to enter and re-export EX: Goods transiting U.S. between Canada & Mexico Import from Canada Re-export to Mexico

125
Bilateral Statistics Will rarely match UN Guidelines
Country of Origin vs. Country of Destination Valuation Reconciliation Studies – on web site

126
Major Sources of Discrepancy
Indirect trade/Re-imports/Re-exports/Multi-country production (Imports from A/Follow $) System of Trade Definition of Country
 System of Trade. Definition of Country.")
127
Major Sources of Discrepancy
Coverage Differences Valuation Differences Transshipments Low-value shipments Chapter 98/99

128
System of Trade General Trade – as crosses border
Special Trade– excludes bonded warehouses and free trade zones Petroleum Alcohol Tobacco Other goods, especially with high taxes/tariffs

129
Definition of Country Which territories/possessions are included
e.g. Puerto Rico, U.S. Virgin Islands ISO Coding Errors IR = Iran, IE = Ireland, IQ = Iraq CH = Switzerland, CN = China

130
Coverage Differences Differences in commodities/types of transactions included Leases Repairs Confidentiality practices Re-imports U.S. – records by country of shipment Some countries – import from themselves Product-specific differences

131
Valuation Differences
Partner country imports are usually c.i.f. U.N. guidelines Will be higher than exports Treatment of assists and other adjustments Third party profit/markup

132
Transshipments Goods exported to one country
Redirected without entry into original partner country E.g. European petroleum to Canada

133
Low Value Shipments Many countries use low-value threshold
Some exclude without estimation

134
Chapter 98/99 Nationally Defined – may include:
Confidentiality suppressions Re-imports Low value Repairs Values can be significant Partner country values likely in HS 1-97

135
Trade Data Reconciliations
Work with partner country to investigate discrepancies Exchange published data Exchange concepts and definitions Do NOT change official statistics!

136
Trade Data Reconciliations
Estimate effect of conceptual differences Insurance & Freight Reimports/Reexports Imports via 3rd countries Geographical differences (e.g. PR/VI) Timing Coverage (e.g. containers) Repairs
 Timing. Coverage (e.g. containers) Repairs.")
137
2006 U.S.-China Analysis In Million U.S. Dollars
U.S. Imports 287,773 Chinese Re-exports +2,971 Geographic Coverage -648 Estimated Valuation Differences -21,035 Indirect Trade -44,058 Timing +2,701 Unresolved -24,232 Chinese Exports 203,472

138
2006 U.S.-China Analysis In Million U.S. Dollars
U.S. Exports 55,224 U.S. Re-exports -3,600 Geographic Coverage -103 Insurance & Freight +3,866 Repairs -146 Unresolved +3,968 Chinese Imports 59,209

139
Contact Info Diane Oberg Special Projects Branch

140
Method of Transportation Data
Port and Method of Transportation Data Bill Regina June 26, 2012 U.S. Census Bureau

141
Objectives Port data definition Method of Transportation (MOT) types
Port and MOT edits/relationship Data quality and other issues

142
3022 What is a Port Code? “30” = Seattle, WA (general district)
“3022” = Spokane, WA (exact port)
")
143
Port Data Definition Exports Vessel or Air –
The airport or seaport where the goods are loaded on the exporting carrier that is taking them out of the United States

144
Port Data Definition, Continued
Exports Overland (to a border country) – The port where the export crosses the U.S. border into a foreign country
 – The port where the export crosses the U.S. border. into a foreign country.")
145
Port Data Definition, Continued
Exports Overland (through a border country) – The port where the goods are loaded on the exporting carrier that is taking them out of the United States
 – The port where the goods are loaded on the. exporting carrier that is taking them out of the. United States.")
146
Port Data Definition, Continued
Imports Port of Entry – The port where the goods clear U.S. Customs Port of Unlading – The port where the goods are unloaded from the conveying vessel or aircraft

147
Method of Transportation (MOT) types
MOT is based on how the merchandise arrives in or departs from the United States. Vessel Air “Other” - Truck - Rail - Etc. (electricity, mail, pipeline)
")
148
Method of Transportation (MOT)
Method of Transportation (MOT) is identified by the method of conveyance that is used when the shipment crosses the border and enters the U.S.
 is identified by the. method of conveyance that is used when the. shipment crosses the border and enters the U.S.")
149
Port and Method of Transportation (MOT) edits
Are the data acceptable? Relationship editing: MOT vs. port MOT vs. commodity MOT vs. other data

150
Data Quality and Other Issues
Container information Reported information: missing, invalid, obsolete, or erroneous

151
Data Quality and Other Issues, Continued
User-Fee and Courier Ports “Special” Districts Published Method of Transportation (MOT) totals at Ports
 totals at Ports.")
152
Questions? Bill Regina (301)
")
153
U.S. Census Bureau Foreign Trade Division
Quality Issues Chris Grieves U.S. Census Bureau

154
Topics Covered Uses of Foreign Trade Statistics Quality Issues
Responses to Quality Issues

155
Uses of Foreign Trade Statistics
Accurate trade data are necessary for economic, commercial, and policy purposes. Used by Government Non-Government

156
Government Uses Develop the merchandise trade figures
To appraise and analyze major movements and trends in international trade To evaluate and plan various programs To measure impact of tariff and trade concessions Statistical base to implement and analyze operations under various international agreements E.g. NAFTA

157
Government Uses (cont.)
Meet legal and regulatory requirements Imports Correctly assess import duties Administer embargoes and quotas Restrict counterfeit items entering the country Implement control policies Exports Effectively administer control and regulatory policies for national security or foreign policy reasons implement export quotas or embargo programs administer short supply programs

158
Non-Government Uses Users in industry, finance, research, and transportation Appraise the general trade situation and outlook Perform market share and penetration studies Aid in product and market development Measure the impact of competition Determine marketing strategies

159
Importance of Data Quality
Principal economic indicator Wide and varied group of users To use information wisely and appropriately need to understand limitations.

160
Topics Covered Foreign Trade Statistics Quality Issues
Responses to Quality Issues

161
Quality Issues Reporting Errors Documentation Low Value Carryover

162
Reporting Errors Mistakes or omissions made by importers, exporters, or their agents when reporting import or export shipments Import information subject to greater scrutiny so more common with exports and duty free imports

163
Reporting Errors Common Data Elements
Quantity or shipping weight State of origin designation Commodity code Charges Census Bureau utilizes edits to detect misreporting and send error messages to the filers

164
Reporting Errors Reasons for Commodity Misclassification Typos
Duty avoidance Not understanding the classification system

165
Reporting Errors Charges Invoiced freight, insurance, or other charges
If included in the invoice price must be included in the Customs Value If an importer does not know the exact value of all charges, must be estimated The filer must have documentation to exclude an item from Custom Value Result is actual value may be inaccurate

166
Quality Issues Reporting Errors Documentation Low Value Carryover

167
Documentation Documentation issues can arise when shipments:
move through an intermediary country consist of rail cars and/or locomotives

168
Documentation Intermediary Country Canada Transiting Goods
Exports to Canada; no EEI required Exports where Canada is not the ultimate destination country; documentation is required Transiting Goods When under bond, excluded from trade statistics Sometimes entered into the US using import entry summary and an export declaration is filed

169
Documentation Imports of Rail Cars
By law importers of rail cars and locomotives are not required to report their shipments, when duty free. Statistics Canada (STC) established a voluntary survey included as a revision to Canada’s export trade data since late 2004
 established a voluntary survey. included as a revision to Canada’s export trade data since late")
170
Quality Issues Reporting Errors Documentation Low Value Carryover

171
What do we mean by “Low Value”?
To reduce filer burden, value-based exemption levels have been in place for many years Current exemption levels Exports - $2500 for all goods Imports - $2000 for most goods $250 for certain quota items Filers not required to file full detail for data valued below exemption level

172
Quality Issues Reporting Errors Documentation Low Value Carryover

173
Carryover Trade records received and/or processed too late for inclusion with records in the correct transaction month Current carryover rate (2011 avg. of total value) 0.13% exports 0.63% imports
 0.13% exports. 0.63% imports.")
174
Topics Covered Foreign Trade Statistics Quality Issues
Responses to Quality Issues

175
Revisions Each month in the FT900, the total import, export, trade balance and “end-use” totals for the prior month are adjusted for carryover SITC (Standard International Trade Classification) and country detail reports not revised at this time.
 and country detail reports not revised at this time.")
176
Revisions Every June of the current year, FTD publishes an annual revision of the previous year Carryover correction Corrections resulting from data investigations Customs and Canadian revisions SITC and country detail reports are revised

177
Low Value Estimation Starting with January 2010 statistics, we implemented new LV estimation methodologies. Improvements with new methodology Estimate of courier low-value transactions Uses current month data to improve timeliness Effort to summarize eligible import data into detailed commodity statistics (similar to process on exports)
")
178
Automated Reporting Effective July 2, 2008 all exports were to be filed through the Automated Export System (AES) Imports can be electronically filed through the Automated Broker Interface (ABI) and the Automated Commercial Environment (ACE)
 and the Automated Commercial Environment (ACE)")
179
Benefits of Automated Reporting
Receive and compile data quickly Reduce Error Exports (as of a 2001 study) 57% of paper SEDs contain errors 10% of AES records contain errors Imports (as of a 2001 study) 37% of Customs Entry Forms 7501 contain errors 8% of ABI records contain errors
 57% of paper SEDs contain errors. 10% of AES records contain errors. Imports (as of a 2001 study) 37% of Customs Entry Forms 7501 contain errors. 8% of ABI records contain errors.")
180
Benefits of Automated Reporting
Online, instant validation checks Reduction in carryover AES Compliance Review Program Eliminates Paper Documents

181
Conclusion FTD continues to monitor the quality of data during collection, processing, and publication. We are constantly exploring ways to further improve the quality of international trade data.

182
Questions ? (301)
")
183
U.S. International Trade in Goods
Balance of Payments Basis Marc Bouchard U.S. Census Bureau Seminar “Understanding and Using Foreign Trade Data” Washington D.C. June 26, 2012

184
Agenda Definition Dollar impact Adjustments by type
Relative dollar magnitudes Future adjustments

185
Goods on a Balance of Payments (BOP) Basis
BOP basis = Census basis + Net BOP adjustments Why BOP adjustments are important: Convert trade data to conform to U.S. international and national accounts guidelines (BOP and GDP) Balance of Payments and International Investment Position Manual, 6th Edition (BPM6) System of National Accounts (2008 SNA) Supplement coverage of Census basis data Eliminate duplication of transactions recorded elsewhere in the international accounts
 Balance of Payments and International Investment Position Manual, 6th Edition (BPM6) System of National Accounts (2008 SNA) Supplement coverage of Census basis data. Eliminate duplication of transactions recorded elsewhere in the international accounts.")
186
BOP Adjustments to Exports and Imports
(In billions of dollars. Details may not sum to totals due to rounding.) Exports of goods, Census basis 1,480.4 Imports of goods, Census basis 2,207.8 Plus: BOP adjustments, net 17.0 28.0 Goods procured in U.S. ports by foreign carriers 18.1 Goods procured in foreign ports by U.S. carriers 14.5 Exports under U.S. military agency sales contracts, net 1.1 Imports by U.S. military agencies, net 4.9 Repair of equipment -4.2 -3.1 Software revaluation 0.2 3.2 Private gift parcel remittances 1.5 Inland freight in Canada and Mexico 6.8 Other adjustments -1.7 Equals: Exports of goods, BOP basis 1,497.4 Equals: Imports of goods, BOP basis 2,235.8
 Exports of goods, Census basis. 1, Imports of goods, Census basis. 2, Plus: BOP adjustments, net Goods procured in U.S. ports by foreign carriers Goods procured in foreign ports by U.S. carriers Exports under U.S. military agency sales contracts, net Imports by U.S. military agencies, net Repair of equipment Software revaluation Private gift parcel remittances Inland freight in Canada and Mexico Other adjustments Equals: Exports of goods, BOP basis. 1, Equals: Imports of goods, BOP basis. 2,")
187
Net BOP Adjustments

188
Goods Procured in Ports (Exports and Imports)
Additions of air and ocean carriers’ purchases of goods in foreign ports beginning with statistics for 1999 Currently limited to purchases of jet fuel and bunker fuel

189
Exports Under U.S. Military Agency Sales Contracts
Net value of two separate adjustments beginning with statistics for 1999: Deduction of goods recorded in Census data as exports under U.S. Foreign Military Sales (FMS) program Addition of primary source data on FMS goods provided to BEA by U.S. Department of Defense
 program. Addition of primary source data on FMS goods provided to BEA by U.S. Department of Defense.")
190
Imports by U.S. Military Agencies
Net value of two separate adjustments beginning with statistics for 1999: Deduction of goods (petroleum and nonpetroleum) recorded in Census data as imports by U.S. military agencies Addition of petroleum purchases abroad by U.S. military agencies provided to BEA by U.S. Department of Defense
 recorded in Census data as imports by U.S. military agencies. Addition of petroleum purchases abroad by U.S. military agencies provided to BEA by U.S. Department of Defense.")
191
Repair of Equipment (Exports and Imports)
Deduction of equipment repair Census data include value of repairs (parts and labor) not covered by warranty Classification of repairs in services, per international guidelines
 not covered by warranty. Classification of repairs in services, per international guidelines.")
192
Software Revaluation (Exports and Imports)
Additions to revalue certain software from media value to market value Export adjustment covers the value of software embedded in smart cards, 2009 forward Import adjustment covers the value of software embedded in smart cards and other media, such as CDs and multimedia DVDs, 1997 forward

193
Private Gift Parcel Remittances (Exports)
Addition of personal parcels shipped abroad via U.S. Postal Service (USPS) because Census data do not cover these items BEA estimates value of parcels shipped abroad based on USPS historical data on the weights of parcels shipped to foreign countries Offset to this credit entry is a debit entry to personal parcel shipments included in private remittances, as part of unilateral transfers
 because Census data do not cover these items. BEA estimates value of parcels shipped abroad based on USPS historical data on the weights of parcels shipped to foreign countries. Offset to this credit entry is a debit entry to personal parcel shipments included in private remittances, as part of unilateral transfers.")
194
Inland Freight in Canada & Mexico (Imports)
Addition of freight charges to transport goods from their point of origin in Canada or Mexico to U.S. customs border To make valuation for imports from Canada and Mexico consistent with U.S. and international guidelines and with U.S. imports from other countries Inland freight charges obtained from supplemental information gathered by Census from Canada and Mexico

195
Other BOP Adjustments Additions of electric energy transmitted to and from Mexico Deductions of motion picture film to avoid duplication with services Addition of nonmonetary gold to account for gold sold by foreign official agencies to private purchasers out of stock held at Federal Reserve Bank of New York (imports) Addition of locomotives/railcars shipped from Canada and Mexico (imports)
 Addition of locomotives/railcars shipped from Canada and Mexico (imports)")
196
BOP Adjustments to Exports

197
BOP Adjustments to Imports

198
BOP Adjustments under Consideration
Merchanting Represents the difference (margin) between the cost of goods bought and resold abroad without entering U.S. customs territory Adjustment would add the margin to Census-basis goods exports Currently margin is recorded in services
 between the cost of goods bought and resold abroad without entering U.S. customs territory. Adjustment would add the margin to Census-basis goods exports. Currently margin is recorded in services.")
199
BOP Adjustments under Consideration
Goods for processing Goods sent abroad or brought into the U.S. for further processing without change of ownership Adjustments would deduct from Census-basis goods the value of the goods crossing the border without change of ownership Fee charged by processor would be added to manufacturing services exports/imports

200
U.S. Census Bureau Foreign Trade Division
A Profile of U.S. Importing and Exporting Companies Ryan Coleman Special Projects Branch June 26, 2012 U.S. Census Bureau Welcome back from lunch Characteristics - Types of companies - # of employees - Known Export Value

201
Profile of U.S. Importing and Exporting Companies 2009 – 2010
Released April 12, 2012 Export data available on FTD Website back to 1996 Reports

202
Profile of U.S. Importing and Exporting Companies 2009 - 2010
What is the Profile? Snapshot of importing and exporting companies within a given data year: Who exports, imports or both exports and imports? What countries do they export to or import from? Where are they importing to or exporting from?

203
Profile of U.S. Importing and Exporting Companies 2009 - 2010
Partially $ponsored by the International Trade Administration (ITA) Produced by linking export and import records to the Census Business Register Tak
 Produced by linking export and import records to the Census Business Register. Tak.")
204
Profile of U.S. Importing and Exporting Companies 2009 - 2010
Export exhibits in the Profile are created using the Exporter Database (EDB): Export records are linked electronically to the Census Business Register by Employer Identification Number (EIN). Clerical matching for Canadian export records From the Business Register we take company NAICS and employment
: Export records are linked electronically to the Census Business Register by Employer Identification Number (EIN). Clerical matching for Canadian export records. From the Business Register we take company NAICS and employment.")
205
Profile of U.S. Importing and Exporting Companies 2009 - 2010
Composition of Total Export Value: 2010 Identified = Matched export records(Known export value) Unidentified = Unmatched export records Other = Low value est., revisions, Gov’t shipments What factors lead to not being able to match companies? Factors that lead increased match rate: less(soon to be none) paper SEDs, matching process becoming more efficient, etc
 Unidentified = Unmatched export records. Other = Low value est., revisions, Gov’t shipments. What factors lead to not being able to match companies Factors that lead increased match rate: less(soon to be none) paper SEDs, matching process becoming more efficient, etc.")
206
Profile of U.S. Importing and Exporting Companies 2009 - 2010
The Profile will give data users access to key characteristics of U.S. Companies: Company type – North American Industry Classification System (NAICS) based Manufacturers Wholesalers Other Unclassified Company size – Number of Employees Small (0-99 employees) Medium ( employees) Large (500 employees)
 based. Manufacturers. Wholesalers. Other. Unclassified. Company size – Number of Employees. Small (0-99 employees) Medium ( employees) Large (500 employees)")
207
Profile of U.S. Importing and Exporting Companies 2009 - 2010
The Profile can give such information as: Value exported by manufacturers in 2010 Canada’s known export value attributable to small companies Number of exporters in Maryland for 2009 vs 2010

208
Profile of U.S. Importing and Exporting Companies 2009 - 2010
Employee Sizes: Known Export Value ($1,137.6 bil.) Number of Exporters (293,131)
 Number of Exporters (293,131)")
209
Profile of U.S. Importing and Exporting Companies 2009 - 2010
2010 Export Concentration % of Known Export Value

210
Profile of U.S. Importing and Exporting Companies 2009 - 2010
Import exhibits in the Profile are created using the Importer Database (IDB), similar to the EDB: Import records are linked to the Census Business Register by the Importer Number Importer Number is based on EIN From the Business Register we take employment and company types
, similar to the EDB: Import records are linked to the Census Business Register by the Importer Number. Importer Number is based on EIN. From the Business Register we take employment and company types.")
211
Profile of U.S. Importing and Exporting Companies 2009 - 2010
2010 Total Import Value Composition Identified = Matched import records(Known import value) Unidentified = Unmatched import records Other = Low value est., revisions
 Unidentified = Unmatched import records. Other = Low value est., revisions.")
212
Profile of U.S. Importing and Exporting Companies 2009 - 2010
Top Company Concentrations: Imports Vs Exports

213
Profile of U.S. Importing and Exporting Companies 2009 - 2010
2010 Number of Companies that Only Export, Only Import, or do Both Importing Companies Only (101,008) Exporting Companies Only (212,491) Companies Exporting and Importing (80,640)
 Exporting Companies Only. (212,491) Companies Exporting and Importing. (80,640)")
214
Profile of U.S. Importing and Exporting Companies 2009 - 2010
Trade to and from Selected Countries for Companies that both Export and Import to those Countries Number of Companies Known Value ($B)
")
215
Profile of U.S. Importing and Exporting Companies 2009 - 2010
Supports federal, state, and local government export promotion programs (e.g. the National Export Initiative) Provides comprehensive data on small and medium companies Assists private-sector providers of import and export services in targeting their products
 Provides comprehensive data on small and medium companies. Assists private-sector providers of import and export services in targeting their products.")
216
Profile of U.S. Importing and Exporting Companies 2009 - 2010
Data users sometimes want specific data not in the Profile. Example: Exhibit 1a of the Profile categorizes large exporting companies as 500+ employees Data user requested data on large exporting companies with additional size category breakouts

217
Profile of U.S. Importing and Exporting Companies 2009 - 2010
The Profile Team Joseph Kafchinski Ryan Coleman Joseph DeCampo (301)
")
218
Profile of U.S. Importing and Exporting Companies
Any Questions?

219
U.S. Census Bureau Foreign Trade Division
State and Sub-State Data Series Joseph DeCampo June 26, 2012 U.S. Census Bureau

220
Background Exports Imports Data Limitations State Data Sub-State Data
Origin of Movement Data ZIP based Data Sub-State Data Metropolitan Data Imports State of Destination Data Data Limitations

221
Export State Data Origin of Movement (OM) State – Based on Origin State Available 1987 – Present Origin of Movement (OM) – ZIP Code Based Available on website starting with January 2006 statistics
 – ZIP Code Based. Available on website starting with January 2006 statistics.")
222
Origin of Movement State Data
Based on the state in which the goods begin their journey to the port of export Example: Goods warehoused in GA transported to a FL port to be shipped to a foreign country. OM state is……GA

223
Origin of Movement State Data
Does not necessarily represent the production origin of U.S. export merchandise For shipments with multi-state origins, report the state from which the commodity with the greatest value begins its journey; if unknown, then report consolidation state. Example: Auto parts produced from many states are consolidated in TX to be exported to Mexico. OM state is…… TX

224
Origin of Movement State Data
Available in our monthly FT-900 Press Release, Supplement, Exhibit 2 State value for Manufacturing and Non-Manufacturing (NAICS)
")
225
Origin of Movement State Data
Downloadable Historical Data (1995-present) Top 25 Commodities and Countries
 Top 25 Commodities and Countries.")
226
ZIP Based State The ZIP Code of the U.S. Principle Party in Interest (USPPI) is used to assign State. Does not necessarily represent the location of the USPPI Effective October 2008, the USPPI should report the address from which the goods begin the journey to the port of export For shipments with multiple origins, report the address from which the commodity with the greatest value begins its journey; if unknown, then report consolidation address.

227
ZIP Based State ZIP Code State examples:
Goods warehoused in GA transported to a FL port to be shipped to a foreign country. ZIP state is ...GA Auto parts produced from many states are consolidated in TX to be exported to Mexico. ZIP state is…… TX

228
ZIP Based State Similar to Origin of Movement table in Supplement, Exhibit 2; is available on our website State value for Manufacturing and Non-Manufacturing (NAICS) Downloadable Historical Data (2006-present) For more information, please contact our Data Dissemination Branch at
 Downloadable Historical Data (2006-present) For more information, please contact our Data Dissemination Branch at")
229
Export State Data Comparisons (2011)
OM State vs. ZIP Based State (Millions of Dollars) State State OM ZIP OM Pct Difference Wyoming 1,224.5 458.0 166.7% Hawaii 909.2 451.6 101.3% Alaska 5,238.3 3,092.4 69.4% Louisiana 55,124.0 67.0% West Virginia 9,002.2 5,402.6 66.6% . Michigan 50,802.3 69,919.3 -27.3% Connecticut 16,198.1 23,349.9 -30.6% Minnesota 20,276.1 31,453.5 -35.5% South Dakota 1,454.7 3,196.4 -54.5% District of Columbia 1,055.3 4,277.4 -75.3%
 State. State OM. ZIP OM. Pct Difference. Wyoming. 1, % Hawaii % Alaska. 5, , % Louisiana. 55, % West Virginia. 9, , % . Michigan. 50, , % Connecticut. 16, , % Minnesota. 20, , % South Dakota. 1, , % District of Columbia. 1, , %")
230
Export State Data Additional export state data: USATrade Online
Monthly OM & ZIP state data is available for purchase. State by 4-Digit NAICS Commodity by Country (Total, Air, Vessel, & Containerized Vessel) State by 6-Digit HS Commodity by Country (Total, Air, Vessel, & Containerized Vessel) For more information, please contact our Data Dissemination Branch at
 State by 6-Digit HS Commodity by Country (Total, Air, Vessel, & Containerized Vessel) For more information, please contact our Data Dissemination Branch at")
231
Export State Data Other products …
Manufacturing and Construction Division (MCD) : Gives exports by state, NAICS and major economic sector. Available online at
 : Gives exports by state, NAICS and major economic sector. Available online at")
232
Sub-State Data Available for export data.
Data historically based on Metropolitan Area (MA). Core Based Statistical Areas (CBSAs) are defined by Office of Management & Budget (OMB) for metro and micro areas. New definitions for CBSAs were announced by OMB in June 2003.
. Core Based Statistical Areas (CBSAs) are defined by Office of Management & Budget (OMB) for metro and micro areas. New definitions for CBSAs were announced by OMB in June")
233
Sub-State Data CBSAs based on ZIP code of US Principle Party in Interest (USPPI). CBSAs now cover areas of 10 to 50 thousand population, which were not covered by Metropolitan Areas. CBSA codes increase coverage to about 93% of the population vs. 80% with MAs.

234
Sub-State Data Per a contract arrangement, we produce Sub-State data for the International Trade Administration (ITA) which they release. To date, we have provided 3-digit ZIP Code & CBSA Metro totals for Export data to ITA.

235
Sub-State Data Next Steps… Prepare 2011 tables for ITA.
The current contract calls for CBSA by 3-digit NAICS, CBSA by Destination, 3-digit NAICS by CBSA, and other tables of trade totals. ITA currently posts data at following address:

236
Import State Data Based on the State of Destination
State value for Manufacturing and Non-Manufacturing (NAICS) Available as of January 2010 statistics Historical tables available starting with January 2008 data A new table added to our monthly FT-900 Press Release, Supplement, Exhibit 2as
 Available as of January 2010 statistics. Historical tables available starting with January 2008 data. A new table added to our monthly FT-900 Press Release, Supplement, Exhibit 2as.")
237
State of Destination Data
State where the merchandise is destined, as known at the time of entry summary filing. Import destination does not indicate where the goods are consumed or used. The state code should be derived from the standard postal two-letter state or territory abbreviation.

238
State of Destination Data
FT-900 Press Release Downloadable Historical Data (2008-present)
")
239
State of Destination Data
Additional import state data: USATrade Online Monthly data available for purchase Import state data by 6-digit HS by Country (Total, Air, Vessel, & Containerized Vessel) Import state data by 4-digit NAICS by Country (Total, Air, Vessel, & Containerized Vessel) For more information, please contact our Data Dissemination Branch at
 Import state data by 4-digit NAICS by Country (Total, Air, Vessel, & Containerized Vessel) For more information, please contact our Data Dissemination Branch at")
240
State Data Limitations
Data reported at the time goods enter or leave U.S. State data do not track interstate flows of goods. Census Bureau discourages the use of these state data to calculate state trade balances. Import sub-state data will not be available. Please visit our website for detailed data limitations information:

241
For more information: Special Projects Branch Foreign Trade Division
(301)
")
242
Any Questions?

Similar presentations


 for Microcontrollers>")


 Grants Chapter 6.>")