Download presentation
Presentation is loading. Please wait.

2
© Worldpanel TM division of TNS 2009 Edward Garner Communications Director Worldpanel – UK Middle-Years Consumers Staverton Park – July 2009

3
© Worldpanel TM division of TNS 2009 Agenda What are we like? How we shop What we buy How we eat Nutrition – Health v Hedonism Impact of the Recession

4
© Worldpanel TM division of TNS 2009 Agenda What are we like? How we shop What we buy How we eat Nutrition – Health v Hedonism Impact of the Recession

5
© Worldpanel TM division of TNS 2009 Agenda What are we like? How we shop What we buy How we eat Nutrition – Health v Hedonism Impact of the Recession

6
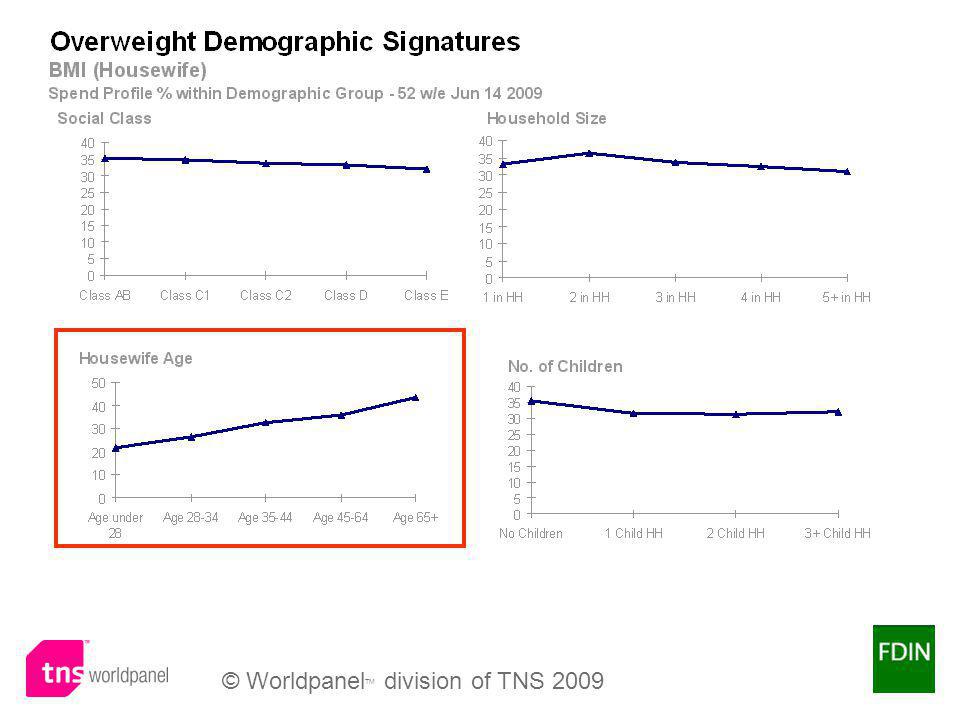
© Worldpanel TM division of TNS 2009 Standard Definitions BMI = Weight / (Height) 2 = Kg / m 2 BMI <18.5Underweight BMI 18.5-24.9Healthy BMI 25-29.9Overweight BMI 30Obese
 2 = Kg / m 2 BMI <18.5Underweight BMI Healthy BMI Overweight BMI 30Obese")
7
© Worldpanel TM division of TNS 2009

11
Lifestyle Indices - Age 45-64 Indexed on All Households 52 w/e Jun 14 2009

12
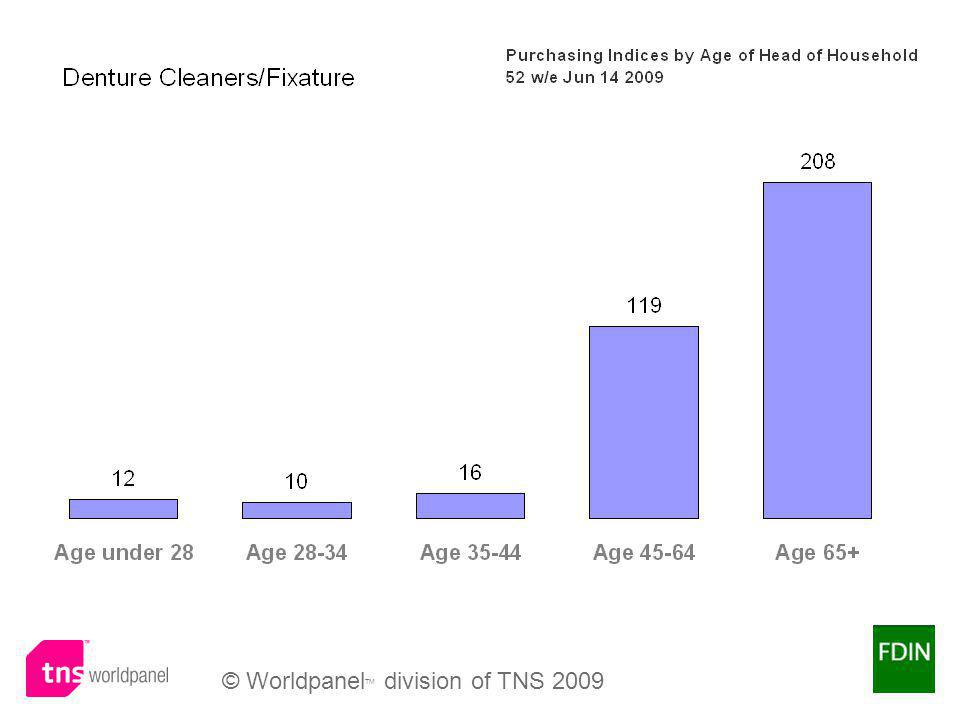
© Worldpanel TM division of TNS 2009 Lifestyle Indices - Age 65+ Indexed on All Households 52 w/e Jun 14 2009

13
© Worldpanel TM division of TNS 2009 Agenda What are we like? How we shop What we buy How we eat Nutrition – Health v Hedonism Impact of the Recession

14
© Worldpanel TM division of TNS 2009

19
Agenda What are we like? How we shop What we buy How we eat Nutrition – Health v Hedonism Impact of the Recession

20
© Worldpanel TM division of TNS 2009

35
Agenda What are we like? How we shop What we buy How we eat Nutrition – Health v Hedonism Impact of the Recession

36
© Worldpanel TM division of TNS 2009 Worldpanel on-line questioning Source: TNS Worldpanel On line Interviews March 2008 A year ago Consumers claimed that if forced to, the first thing they would cut down on would be eating out 20.3 19.9 17 10.3 8.8 6.7 5.5 4.1 3.5 3.1 0.8 18.5 12.5 10.7 10.5 11.3 12.4 3.8 4.9 5.4 6.8 3 Eating out Clothing & Footwear Alcohol & Tobacco Music Entertainment SkyTV Mobile phone Leisure facilities Miscellaneous Housing/hhold bills Food & drink Transport Petrol Health/PersnlCare/Toil 1 st choice 2 nd choice If you were now forced to, which of the following items would you actually cut back spending on ?

37
© Worldpanel TM division of TNS 2009 % Change in Heads through the door Source: NPD GROUP/ CREST By the end of last year we were voting with our feet as the number of us eating out in pubs and restaurants declines YonY Qtr change % Ch in Traffic

38
© Worldpanel TM division of TNS 2009 Total Foods Source: WorldPanel Usage As we are eating out less, so the number of in home meals has been on the increase Billions of Occasions 1 in 4 meals

39
© Worldpanel TM division of TNS 2009 Total Foods Source: WorldPanel Usage 1 in 4 meals are consumed by 45-64s % Occasions

40
© Worldpanel TM division of TNS 2009 In Home Meals Lunch, Teatime and Evening Meal Source: WorldPanel Usage Homemade Ms Meal Occasions Homemade meals in particular are showing recent growth +7%

41
© Worldpanel TM division of TNS 2009 In home foods Source: WorldPanel Usage As the Recession has kicked in, 45-64s are one of the fastest growing consumers of home made food Millions of Meals featuring something home made +0.7% +3.2% +4.2% Growth for 45- 64s vs May 2008

42
© Worldpanel TM division of TNS 2009 In Home Foods 12 me Feb 09 Source: WorldPanel Usage Key Foods for 45-64s % Consumption by 45-64s

43
© Worldpanel TM division of TNS 2009 Is it party time when the kids leave?

44
In Home Foods 12 me Feb 09 Source: WorldPanel Usage Once the kids are gone its time for a fry up and less pasta, cooking sauces and chips Foods more likely to be consumed by 45-64s in households without kids Foods more likely to be consumed by 45-64s in households with kids Index of foods consumed by 45-64s in HH with kids vs HH without kids

45
© Worldpanel TM division of TNS 2009 2008 attitudes Study Source: WorldPanel Usage 45-64s are the less likely to be Vegetarian … % Vegetarian

46
© Worldpanel TM division of TNS 2009 … But they are cutting back on meat % Eating Less meat 2008 attitudes Study Source: WorldPanel Usage

47
© Worldpanel TM division of TNS 2009 45-64s like to make their breakfast slightly healthier % having on their breakfast cereal 2008 attitudes Study Source: WorldPanel Usage

48
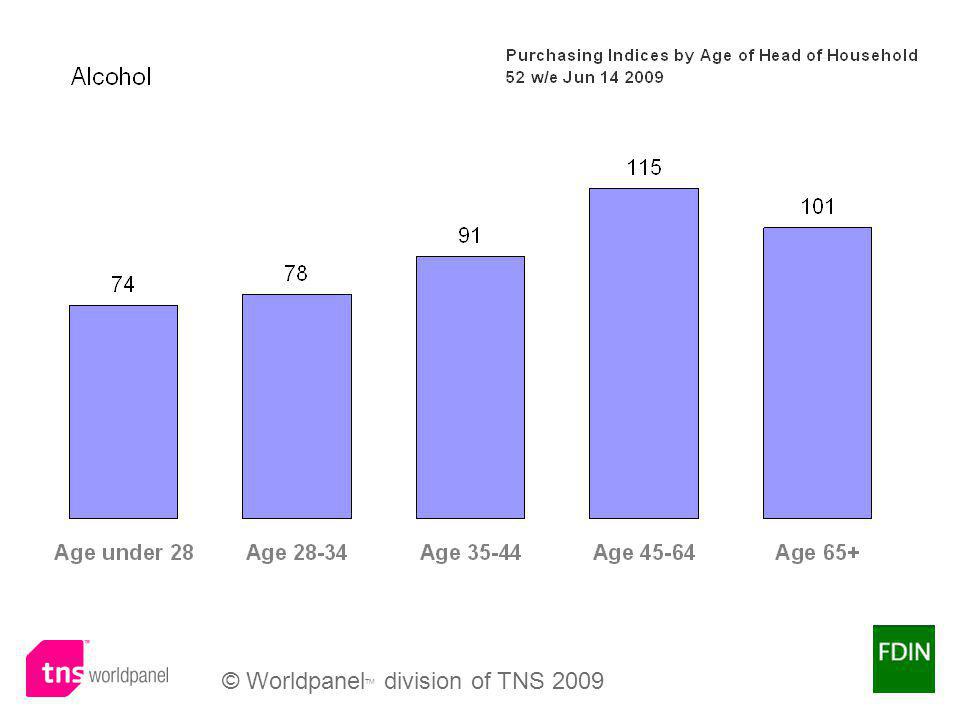
© Worldpanel TM division of TNS 2009 45-64s still like a drink … % Teetotal 2008 attitudes Study Source: WorldPanel Usage

49
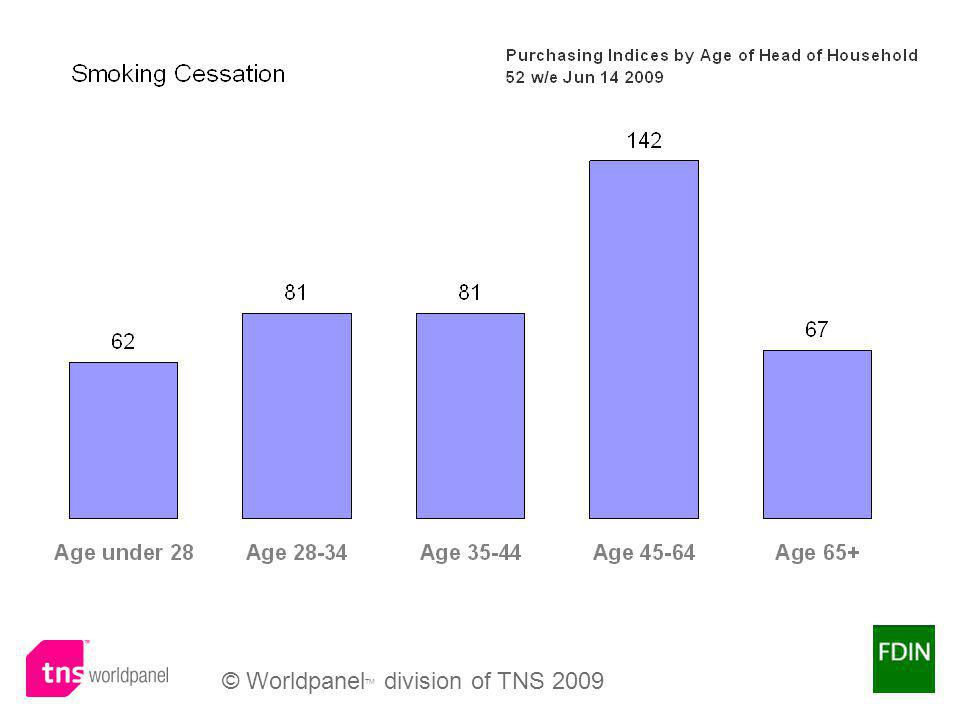
© Worldpanel TM division of TNS 2009 … But tend not to smoke % Smoking 2008 attitudes Study Source: WorldPanel Usage

50
© Worldpanel TM division of TNS 2009 Activity wise, 45-64s prefer Gardening % taking part in each week 2008 attitudes Study Source: WorldPanel Usage

51
© Worldpanel TM division of TNS 2009 Are you getting your x a day? In climates such as the UK, we should drink approximately 1.2 litres (6 to 8 glasses) of fluid every day to stop us getting dehydrated
 of fluid every day to stop us getting dehydrated.")
52
1 in 3 of us claim to be hitting the 5-a-day target. Similar level for Dairy but we are well behind on Wholegrain and Water How many portions of the following do you normally eat or drink in a day? 6 m/e Nov08 TNS WorldPanel Usage 36 137= % Hitting Target 5338= Recommended Target

53
The reality is that only 1 in 10 of us now hitting the target Average number of fruit & veg portions consumed per day TNS WorldPanel Usage

54
© Worldpanel TM division of TNS 2009 Only 65+s have a higher score for 5-a-day consumption than 45-64s Average number of fruit & veg portions consumed per day TNS WorldPanel Usage

55
© Worldpanel TM division of TNS 2009 Agenda What are we like? How we shop What we buy How we eat Nutrition – Health v Hedonism Impact of the Recession

56
© Worldpanel TM division of TNS 2009 Conundrum The conundrum on health is that as consumers, we cite health as the reason for our choice of meals twice as often as we did 10 years ago. Yet as a nation, our obesity levels have increased by 50% over the same period – indeed, they have doubled since the mid- 1980s.

57
12 year trend ENJOYMENT 40% HEALTH 22% PRACTICALITY 38% % Servings BSE, Foot & Mouth, Sudan 1, Child Obesity, Jamie Oliver, Bird Flu, Supersize me, Salt & sugar content, Functional Foods, 5 a day, Fruit for schools Organics/ premium, Finest, Taste the difference, Sharing, Café culture, Eating out, Debit Credit, Treating Ready Meals, Light meals, Snacking, Budget, Microwave, Individual portions, Quick to cook 20081996 11% 55% 34%

58
© Worldpanel TM division of TNS 2009 Salt The TNS Worldpanel research shows that UK households on average buy the equivalent of nine 750g packs of salt a year. However, 87% of that 6.75kg of purchased salt is bought as an ingredient in other products. In other words, only 9% of our sale intake is in the form of salt added to a finished meal or in cooking. Such a situation accounts for the reason why so much government effort is directed towards food manufacturers reducing the level of salt in their products. Not everyone is equally bad, though. The statistics show that 10% of households account for 24% of salt purchased – so there would appear to be significantly high use in certain households. Further analysis shows these tend to be smaller households (arguably more reliant on prepared/packaged foods) and older households (for similar reasons plus perhaps a lifestyle reason that they habitually tend to add salt to their meals).
 and older households (for similar reasons plus perhaps a lifestyle reason that they habitually tend to add salt to their meals)..")
59
Energy, unsurprisingly flat profile Energy, Index of purchasing composition vs Volume

60
Protein clearly biased towards older, post family groups Protein, Index of purchasing composition vs Volume Fresh Red Meat & Eggs

61
Fibre, primary bias towards Pre Family groups Fibre, Index of purchasing composition vs Volume Veg/Fruit – (pre packed), Frozen prepared food
, Frozen prepared food")
62
Sugars, greater bias towards oldest single elderly group Sugars, Index of purchasing composition vs Volume Fruit Sugar Biscuits Breakfast Cereals

63
Fat, similar profile to Protein Fat, Index of purchasing composition vs Volume Fresh Red Meat Yellow Fats

64
Saturated Fats, clear lifestage progression, biased towards oldest groups Sat Fat, Index of purchasing composition vs Volume Fresh Red Meat Yellow Fats Fresh Red Meat Biscuits

65
Salt, again, biased towards oldest groups Sodium, Index of purchasing composition vs Volume Table Salt Bread Table Salt

66
Similar pattern across all of the key focus nutrients Index of purchasing composition vs Volume

67
Fibre, Fruit and Vegetables the most marked discriminator Fibre, Index of purchasing composition vs Volume Fruit and Vegetables

68
Large bias towards the lowest social class groups Sugars, Index of purchasing composition vs Volume Biscuits Sugar

69
Fat biased towards lower socio-economic groups Fat, Index of purchasing composition vs Volume Biscuits Yellow Fats

70
More extreme picture on Saturated Fats, clearly lower socio economic groups less effective at managing diet Sat Fat, Index of purchasing composition vs Volume Biscuits Yellow Fats Biscuits Yellow Fats Frozen Confectionery

71
Bread and Table salt the key discriminating factors in high salt purchasing amongst the lower socio-economic groups Sodium, Index of purchasing composition vs Volume Table Salt Bread

72
Again, a consistent view across the three key nutrients Index of purchasing composition vs Volume

73
Obese homes high purchase of salt, saturates and fat Index of purchasing composition vs Volume

74
Waitrose – Impressive profile, increases in fibre Waitrose growth rates of Nutrients 52we Year on Year

75
© Worldpanel TM division of TNS 2009 Agenda What are we like? How we shop What we buy How we eat Nutrition – Health v Hedonism Impact of the Recession

76
© Worldpanel TM division of TNS 2009

78
Grocery Price Inflation – TNS Calculation Based on year-on-year comparisons of price paid for over 75,000 identical products including promotions and in the proportion that British households are purchasing them

79
Total RST – Key Dynamics to 14 June 2009 12 w/e 14 June 2009

80
Tesco Morrisons Sainsbury's Waitrose Somerfield M&S Asda Lidl Iceland Aldi Discount Retailers Premium Retailers Clear movement to the value end of the spectrum but Tesco is losing to Sainsburys more than to Asda. Total Grocery 12we 17th May 2009 Significant (Top 20) grocery switching flows
 grocery switching flows.")
81
Switching through price tiers in the Big 4 Trading down a reality, but branded steals from standard OL Standard Own Label Branded Value Own Label Premium Own Label Switching limited to Big 4 retailers and 4 tiersTotal Grocery 12we 17 th May 2009 Switching through price tiers in the Big 4

82
© Worldpanel TM division of TNS 2009

85
Latest 12-wk % Change +29% +16% +56% +72%

86
© Worldpanel TM division of TNS 2009

87
Reminders

88
© Worldpanel TM division of TNS 2009 Reminders What are we like?

89
© Worldpanel TM division of TNS 2009 How we shop Reminders What are we like?

90
© Worldpanel TM division of TNS 2009 What are we like? What we buy Reminders How we shop

91
© Worldpanel TM division of TNS 2009 How we eat What are we like? Reminders How we shop What we buy

92
© Worldpanel TM division of TNS 2009 What are we like? Reminders Nutrition How we shop What we buy How we eat

93
© Worldpanel TM division of TNS 2009 Recession What are we like? Reminders How we shop What we buy How we eat Nutrition

94
© Worldpanel TM division of TNS 2009 Thank you ed.garner @tns-global.com

Similar presentations


 Definitions: Obesity: having a very high amount of body fat in relation to lean body mass, or Body Mass Index.>")
 and understand its scope and effects Share who some of the.>")


 Adult Nutrition.>")

, or Quetelet index, is a measure for human body shape based on an individual's weight and height.>")


