Download presentation
Presentation is loading. Please wait.

1
COUNTRY PROGRESS REPORT ON UNITED NATIONS GENERAL ASSEMBLY SPECIAL SESSION ON HIV AND AIDS (UNGASS) 2010 Monitoring the Declaration of Commitment on HIV/AIDS Presented By Dr. Agnes Dzokoto

2
Outline Introduction Methodology Indicators
National Programme Indicators Knowledge and Behavior Indicators Impact Indicators National Commitment Indicators Conclusion and Recommendations

3
UNGASS United Nations General Assembly Special Session on HIV and AIDS (UNGASS) (25th – 27th June 2001) 189 Members adopted the declaration of commitment including Ghana Under terms of the Declaration of the Commitment on HIV/AIDS success in the AIDS response is measured by the achievement of concrete time bound targets

4
“For there to be any hope of success in the fight against HIV/AIDS, the world must join together in a great global alliance. ….. My great hope is that it signals the emergence of a response to this deadly disease — by Governments, multilateral organizations, the private sector and civil society — that could soon match the scale of the epidemic itself.” Secretary General, Kofi Annan

5
Priorities of UNGASS in 2001
to ensure that people everywhere —particularly the young — know what to do to avoid infection to stop perhaps the most tragic of all forms of HIV transmission — from mother to child; to provide treatment to all those infected; to redouble the search for a vaccine, as well as a cure; and to care for all whose lives have been devastated by AIDS, particularly orphans.

6
Areas addressed at UNGASS
Leadership Prevention Care, support and treatment HIV/AIDS and human rights Reducing vulnerability Children orphaned and made vulnerable by HIV/AIDS Alleviating social and economic impact Research and development HIV/AIDS in conflict and disaster-affected regions Resources Follow-up

7
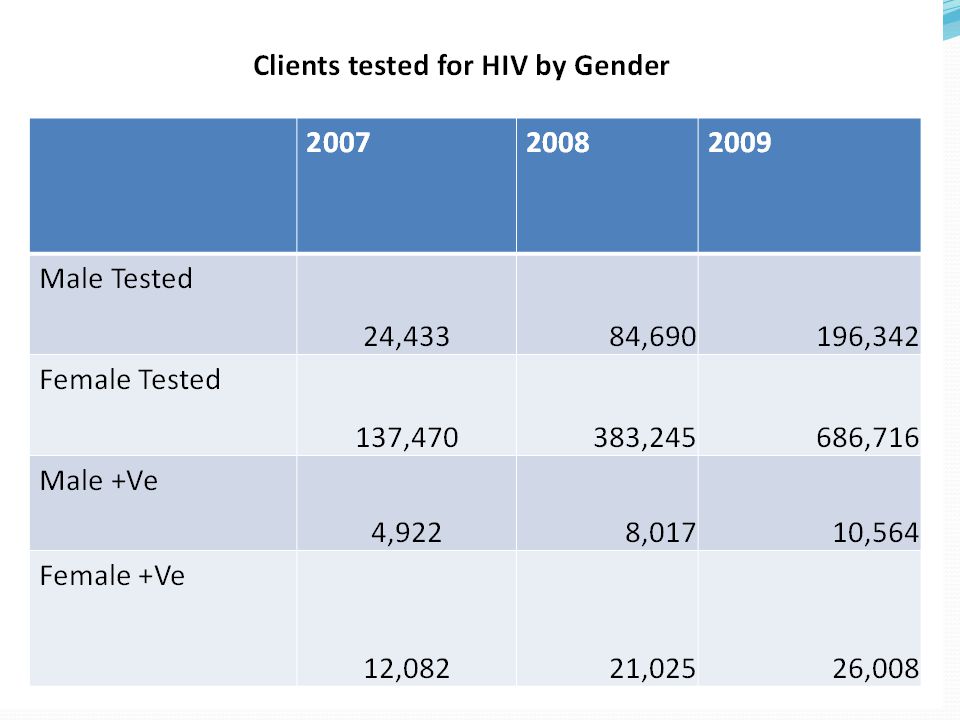
Purpose of UNGASS report
To provide key constituents who are active in a country response to AIDS with essential information on core indicators that measure the effectiveness of the national response Identify problems and constraints and recommend action to accelerate achievement of the targets Information provided by country reports represent the most comprehensive set of standardised data on the status of the epidemic and progress on the response.

8
Core Indicator of UNGASS
1. National Commitment and action Expenditure on AIDS (NASA) Policy , strategic and financial inputs (NCPI) 2. National Programmes 3. National Knowledge and behavior Specific knowledge and sexual behavior outcomes, school attendance among orphans 4. Impact Reduction in HIV prevalence, morbidity and mortality rates
 Policy , strategic and financial inputs (NCPI) 2. National Programmes. 3. National Knowledge and behavior. Specific knowledge and sexual behavior outcomes, school attendance among orphans. 4. Impact. Reduction in HIV prevalence, morbidity and mortality rates.")
9
Methodology Desk review Key informant Interviews
Stakeholder consensus building workshop Stakeholder validation Report Finalisation

10
National Commitment and Action
AIDS spending Government and HIV and AIDS Policies

11
AIDS Spending Spending Category 5,339,318 Public spending 923,075
2009 Public spending 5,339,318 Private spending 923,075 International Funds 32,588,547 Grand Total 38,850,940

12
AIDS spending Spending Category Amount in US Dollars Percentage
Prevention 8,550,916 22.01 Care and treatment 9,554,075 24.59 OVC 425,999 1.10 Programme Management and Administration 11,603,866 29.87 Human Resources 4,661,299 12.00 Social Protection 754,620 1.94 Enabling Environment 2,138,620 5.50 Research 1,161,545 2.99 Grand total 38,850,940 100.00

13
NCPI Area\Score 2005* 2007 2009 Strategic Planning 7 8 7.25 Political Support 7.3 Human rights 3.7 5 Enforce the existing policies laws and regulations 2 3.5 7.75 Policy efforts in support of HIV prevention Efforts in implementation of HIV prevention programmes 3.8 7.1 6.75 Care and support 4.5 7.5 8.25 Efforts to meet needs of OVC 6 Civil society/ involvement Monitoring and evaluation 7.2 Total 33 60.1 69.5 Average 5.5 6.68 6.95

14
National Composite Index 2005 - 2009

15
National Programme Indicators
Blood safety Prevention of Mother to Child Transmission Co-Management of Tuberculosis and HIV treatment HIV testing in the General Population HIV testing in Most at risk Populations Support for Children affected by HIV and AIDS Life skills based HIV education in schools

16
3. Percentage of donated blood screened for HIV in a quality assured manner
100 % of blood is screened for HIV Blood donation is decentralized Blood screening is conducted for HIV, Hepatitis B, C and syphilis

17
4. Percentage of women and men with advanced HIV infection receiving ART

18
Male and female clients enrolled on ART

19
5. Percentage of HIV positive pregnant women who receive a complete course of ART to prevent mother to child transmission in the last 12 months

20
6. Percentage of estimated HIV-positive incident TB cases that receive treatment for TB and HIV
A lot is being done in this area but data is not adequately collected 531 cases of TB /HIV were recorded and provided with co-management in 2009

21
7. Percentage of respondents who received an HIV test result and know their results in the last 12 months. 2003 2008 Age group Male Female 15- 24 1.6% 1.7% 8.2% 4.9% 15-19 1.1% 1.0% 2.6% 20-24 2.4% 5.7% 7.6% 25-29 3.2% 4.7% 12.5% 30-39 4.2% 2.9% 8.0% 3.6% 1.8% 3.7% overall 3.3% 2.3% 4.1% 6.8%

23
9. Percentage of MARP reached with prevention programmes
8. Percentage of MARP who received an HIV test in the last 12 months and who know their status No data available 9. Percentage of MARP reached with prevention programmes 16,742 FSW were reached from December 2008 to December 2009 Total estimated sex workers 34,990 Percentage sex workers reached 47.9%

24
10. Percentage of OVC whose household received free basic external support in caring for a child
In 2008, 4,064 were supported through the Livelihood Empowerment Against Poverty (LEAP) project 2009, 10,722 OVC received support in 41 districts This represents 7.36% of all OVC in the country
 project. 2009, 10,722 OVC received support in 41 districts. This represents 7.36% of all OVC in the country.")
25
11. Percentage of school that provided life-skills based HIV education in the last academic year
public private total total number of schools 19,778 5,061 24,839 Schools with HIV FLHE 16,618 3.032 19,650 percentage of schools with HIV FLHE 84.0% 59.9% overall percentage 79.1%

26
Knowledge and behavior Indicators
Orphans : School attendance Young people : knowledge and HIV prevention MARPS: knowledge about HIV transmission Prevention Sex before the age of 15 Higher-risk sex Condom use during higher risk sex Sex worker condom use MSM condom use IDU condom use IDU sexual practices

27
12. Current school attendance among orphans and non-orphans aged 10–14
School attendance in children whose parents are both dead is 67% School attendance in children whose parents are both living is 88% The ratio of school attendance is 0.76

28
Trend of school attendance among orphans and non-orphans aged 10–14
2003 2006 2008 orphans 65% 88.9% 67% non orphan 81% 85.8% 88% Ratio 0.80 1.04 0.76

29
13. Percentage of young people aged 15–24 who both correctly identify ways of preventing the sexual transmission of HIV and who reject major misconceptions about HIV transmission In 2008, only 28.3% of female respondents and 34.2% of men had comprehensive knowledge in about HIV and AIDS. In 2006, 25.1% of young women and 33% of young men aged years had comprehensive knowledge . Little change has been noted in the comprehensive knowledge of young people

30
14. Percentage of most-at-risk populations who both correctly identify ways of preventing the sexual transmission of HIV and who reject major misconceptions about HIV transmission Indicators Seater Roamer % Change Δ Correctly identified ways of preventing sexual transmission of HIV/AID 2006 2009 Seaters Roamers Abstinence 48.1 30.7 29.5 20.0 +17.4 +9.5 Use of condoms 46.7 32.6 29.6 18.4 +14.1 +11.2 Being faithful to one uninfected partner 47.4 31.7 29.8 18.9 +15.7 +10.9 And reject misconceptions about transmission: HIV not transmitted by mosquitoes 48.6 35.3 30.6 18.6 +13.3 +12.0 HIV not transmitted through used needle 48.5 31.6 +16.9 +12.2 HIV transmitted to unborn 47.8 31.0 +16.1 +12.1 HIV not transmitted by healthy looking people 48.2 32.5 31.4 18.5 +12.9 Disease to newborn 50.5 32.0 18.8 +18.5 +13.2

31
13. Percentage of young women and men aged 15–24 who have had sexual intercourse before the age of 15 Age Females Males 7.5% 4.4% 9.3% 2.5% 15 – 19 8.2% 3.6% 20 -24 7.2% 5.2% 15 – 24 7.8% 4.3%

32
Percentage of young women and men aged 15–24 who have had sexual intercourse before the age of 15 in 2003 and 2008

33
16. Percentage of women and men aged 15–49 who have had sexual intercourse with more than one partner in the last 12 months 2003 2008 Age Female Male 15- 49 1.1% 9.9% 1.0% 11.3% 15 – 19 1.5% 2.4%% 1.2% 3.1% 20 – 24 1.9% 10.4% 1.6% 9.6% 25 – 29 0.4% 13.8% 1.7% 16.7% 13.5% 0.5% 15.5% 11.1% 0.2% 12.4%

34
Percentage of women and men aged 15–49 who had more than one partner in the past 12 months who used a condom during their last sexual intercourse This indicator is not measured in the GDHS since the higher risk sex is defined differently and the indicator is measured for men only 2003 2008 Age Female Male 15- 49 28% 44.8% 25.4% 45.1% 15 – 19 33.5% 46.2% 24.4% 40.3% 20 – 24 32% 54.7% 31.1% 48.9% 25 – 29 27.4% 43.3% 31.3% 49.3% 13.1% 37.1% 11.0% 45% 11.2% 37.5% 6.3% 27.1%

35
aged 15 -49 with more than one sexual partner.
Percentage of women and men aged 15–49 who had more than one partner in the past 12 months who used a condom during their last sexual intercourse For men only aged with more than one sexual partner. 26.2% used a condom in the last sexual act % % % % %

36
18. Percentage of female and male sex workers reporting the use of a condom with their most recent client 95.6% of FSW 19. Percentage of men reporting the use of a condom the last time they had anal sex with a male partner 50.5% of MSM

37
Injecting Drug Users Percentage of injecting drug users reporting the use of a condom the last time they had sexual intercourse Percentage of injecting drug users reporting the use of sterile injecting equipment the last time they injected Data for these indicators are not available. A study must be commissioned for this purpose

38
Impact Indicators Reduction in HIV prevalence
MARPS reduction in HIV prevalence HIV treatment after 12 months survival Reduction of mother to child transmission

39
Percentage of young people aged 15–24 who are HIV infected
Year HIV prevalence 2006 2.5% 2007 2.6% 2008 1.9% 2009 2.1%

40
HIV prevalence in 2006 – 2009 in 15 -24 years

41
Percentage of most-at-risk populations who are HIV-infected
Location and type category of sex worker 2006 2009 Accra Roamers 28.5 17.4 Seaters 51.8 32.6 All Accra FSW 39.1 25.0 Kumasi 21.9 21.2 39.3 28.7 All Kumasi FSW 30.7 24.9 All roamers 25.2 19.3 All seaters 45.0 Overall 34.7

42
Impact indicators (continued)
Percentage of adults and children with HIV known to be on treatment 12 months after initiation of antiretroviral therapy 89.8% of clients on first line are still on treatment after 12 months Percentage of infants born to HIV-infected mothers who are infected More detailed information required from Early infant diagnosis. Modeling required

43
Some Best Practices Models of Hope
Strategic Planning with greater stakeholder involvement Mobile counselling and testing and Know your status campaign Public Private Partnerships – workplace programmes

44
Some challenges Inadequate resources for implementation of activities
Inadequate numbers of skilled human resources at the decentralised level Lack of comprehensive HIV prevention interventions targeted at addressing the gaps in knowledge and behavior Stigma and discrimination Slow progress at addressing policies and laws which are obstacles in HIV prevention and treatment

45
Conclusion and Recommendations for UNGASS reporting
Much progress has been made Gaps have been seen especially in the area of HIV prevention Ensure that research is commissioned on all indicators to address data gaps for better monitoring Ensure that we use the data generated for future planning Ensure that we monitor the implementation of the recommendations

46
Thank you for your attention

Similar presentations


 patients Policy.>")


