Download presentation
Presentation is loading. Please wait.

1
Sections Review

2
Relationship between two variables
Bivariate data

3
What three shapes are possible for a bivariate data relationship?

4
What three shapes are possible for a bivariate data relationship?
Linear Curved No shape

5
Shape : Linear

6
Shape : Linear

7
Shape: Curved

8
Shape: Curved

9
Shape: Curved

10
Shape: None

11
Shape: None

12
The line on the plot is the ____________.

13
The line on the plot is the least squares regression line, LSRL, or regression line.

14
Two main reasons to fit a line to a set of data:

15
Two main reasons to fit a line to a set of data:
1) to find a summary or model that describes relationship between two variables 2) to use the line to predict value of y when you know value of x
 to find a summary or model that describes relationship between two variables. 2) to use the line to predict value of y when you know value of x.")
16
To make a reasonable prediction, what needs to be true about:
A) shape of data? B) strength of relationship?
 shape of data B) strength of relationship")
17
To make a reasonable prediction, what needs to be true about:
A) shape of data? linear B) strength of relationship?
 shape of data linear. B) strength of relationship")
18
To make a reasonable prediction, what needs to be true about:
A) shape of data? linear B) strength of relationship? Stronger the better
 shape of data linear. B) strength of relationship Stronger the better.")
19
Usually, the independent variable, x, is on the horizontal axis.
Dependent variable, y, is on vertical axis,

20
Statistics, not Algebra!
The variable on the x-axis is called the __________ or __________ variable. The variable on the y-axis is called the __________ or __________ variable.

21
Statistics, not Algebra!
The variable on the x-axis is called the predictor or explanatory variable. The variable on the y-axis is called the __________ or __________ variable.

22
Statistics, not Algebra!
The variable on the x-axis is called the predictor or explanatory variable. The variable on the y-axis is called the predicted or response variable.

23
Which is correct? Year vs Minimum Wage or Minimum Wage vs Year?

24
Which is correct? Year vs Minimum Wage or Minimum Wage vs Year?

25
Two types of predictions:

26
Two types of predictions:
1) interpolation – making prediction when value of x falls within range of the data
 interpolation – making prediction when value of x falls within range of the data.")
27
Two types of predictions:
1) interpolation – making prediction when value of x falls within range of the data 2) extrapolation – making prediction when value of x falls outside range of actual data
 interpolation – making prediction when value of x falls within range of the data. 2) extrapolation – making prediction when value of x falls outside range of actual data.")
28
Two types of predictions:
1) interpolation – making prediction when value of x falls within range of the data 2) extrapolation – making prediction when value of x falls outside range of actual data Interpolation fairly safe Extrapolation risky especially the further x-value is outside range of actual data
 interpolation – making prediction when value of x falls within range of the data. 2) extrapolation – making prediction when value of x falls outside range of actual data. Interpolation fairly safe. Extrapolation risky especially the further x-value is outside range of actual data.")
29
Prediction error: difference between the actual value of y and value of y predicted from a regression line Usually unknown except for the points used to construct the regression line, whose prediction errors are called residuals

30
Residual = observed value of y – predicted value of y
Residual = y - y

31
Residual is the signed vertical distance from an observed data point to the regression line.
Positive if point above the line Negative if point below the line 0 if point on the line

32
Least squares regression line, also called least squares line or regression line, is the line for which the sum of the squared errors or SSE is as small as possible. SSE = (residuals)2
2.")
33
Find the least squares line for this passenger jets data.

34
Put explanatory values in L1 and response values in L2

35
Put explanatory values in L1 and response values in L2
STAT CALC 8. LinReg (a + bx) LinReg (a + bx) L1, L2, Y1 (Y1 needed if want to show LSRL on graph)
 LinReg (a + bx) L1, L2, Y1. (Y1 needed if want to show LSRL on graph)")
36
Put explanatory values in L1 and response values in L2
STAT CALC 8. LinReg (a + bx) LinReg (a + bx) L1, L2, Y1 To get Y1, go to VARS, Y-VARS, 1: Function, ENTER, 1: Y1, ENTER
 LinReg (a + bx) L1, L2, Y1. To get Y1, go to VARS, Y-VARS, 1: Function, ENTER, 1: Y1, ENTER.")
37
LinReg y = a + bx a = b = 16 r2 = r = So, what is equation for LSRL?

38
LinReg y = a + bx a = b = 16 r2 = (Turn Diagnostic On) r = So, what is equation for LSRL?

39
y = 367 + 16x Is this it? LinReg y = a + bx a = 366.6666667 b = 16
So, what is equation for LSRL? y = x Is this it?

40
Is this it? No! Need equation in context!
LinReg y = a + bx a = b = 16 r2 = r = So, what is equation for LSRL? y = x Is this it? No! Need equation in context!

41
Is this it? No! Need equation in context! Cost = 367 + 16(seats)
So, what is equation for LSRL? y = x Is this it? No! Need equation in context! Cost = (seats)
")
42
Cost = (seats) Interpret the slope and y-intercept.
 Interpret the slope and y-intercept.")
43
Cost = (seats) Interpret the slope and y-intercept. Slope: For each additional seat, the cost increases by about $16 per hour

44
Cost = (seats) Interpret the slope and y-intercept. Slope: For each additional seat, the cost increases by about $16 per hour y-intercept: If a passenger jet had 0 seats, it would cost $367 per hour to operate.

45
Correlation What do you recall about correlation?

46
Correlation Measures strength and direction of a linear relationship between two variables Numerical value between -1 and 1, inclusive How tightly packed points of scatterplot are about the LSRL Correlation and slope always have the same sign

47
Sketch ellipse around points in scatterplot.
If ellipse has points scattered throughout and points appear to follow a linear trend, then correlation is a reasonable measure of strength of the relationship.

48
No shape

49
Does a higher correlation mean the relationship is more like a line, less like a line, or neither?

50
Does a higher correlation mean the relationship is more like a line, less like a line, or neither? Neither if misused

51
r = 0.91 for this data but a linear model is not appropriate as growth is exponential.

52
Here r = In spite of the scatter, a linear model is appropriate because there is no curvature in the pattern of data points.

53
Moral of this story: Always plot your data before deciding a linear model is appropriate for your data.

54
Moral of this story: Always plot your data before deciding a linear model is appropriate for your data. Correlation is only meaningful if a linear model is appropriate for your data.

55
When the correlation is small in absolute value, what does it mean for the prediction error?

56
When the correlation is small in absolute value, the error in prediction will be larger than if the correlation were larger.

57
When the correlation is small in absolute value, the error in prediction will be larger than if the correlation were larger. A larger correlation (near 1 or -1) means the points are generally closer to the LSRL, and predictions using the line will be relatively close to the observed values.
 means the points are generally closer to the LSRL, and predictions using the line will be relatively close to the observed values.")
58
True or false: A high correlation means that a change in the explanatory variable causes a change in the response variable.

59
True or false: A high correlation means that a change in the explanatory variable causes a change in the response variable. False. Correlation does not imply causation as there may be a lurking variable involved.

60
r2 is the coefficient of determination.
This tells us the proportion of total variation in the y-variable that is “explained” by the variation in the x-variable.

61
Enter the information about
Fat and Calories for 7 kinds of pizza in calculator. Find LSRL equation, r, and r2.

62
Calories = (fat) r = 0.908 r2 = 0.824 Interpret slope, intercept, and r2.
 r = r2 = Interpret slope, intercept, and r2.")
63
Calories = (fat) Slope: For each 1 gram increase in fat, the calories increase by about 14.9
 Slope: For each 1 gram increase in fat, the calories increase by about")
64
Calories = (fat) Slope: For each 1 gram increase in fat, the calories increase by about 14.9 Intercept: If there were 0 grams of fat in a pizza there would be 112 calories.

65
Calories = (fat) Slope: For each 1 gram increase in fat, the calories increase by about 14.9 Intercept: If there were 0 grams of fat in a pizza there would be 112 calories. r2 = 0.824: About 82% of the variation in calories among these brands of pizza can be attributed to fat content.

66
Both plots have a correlation of 0. 26
Both plots have a correlation of For each plot is fitting a regression line appropriate, why or why not?

67
Left plot has strong curvature so LSRL not appropriate
Left plot has strong curvature so LSRL not appropriate. Right plot is linear as cloud of points is roughly elliptical.

68
Residual plots may help you uncover more detailed patterns.
A residual plot that shows nearly random scatter, with no obvious trends is the ideal shape for a residual plot. This indicates that a line is a reasonable model for the trend in the original data.

69
This model looks nearly linear, but is a line a suitable model?

70
Residual plot dramatically reveals the trend is not as linear as first thought.

71
Curvature in residual plot mimics curvature in original scatterplot, which is harder to see. So line is not a good model for these data.

72
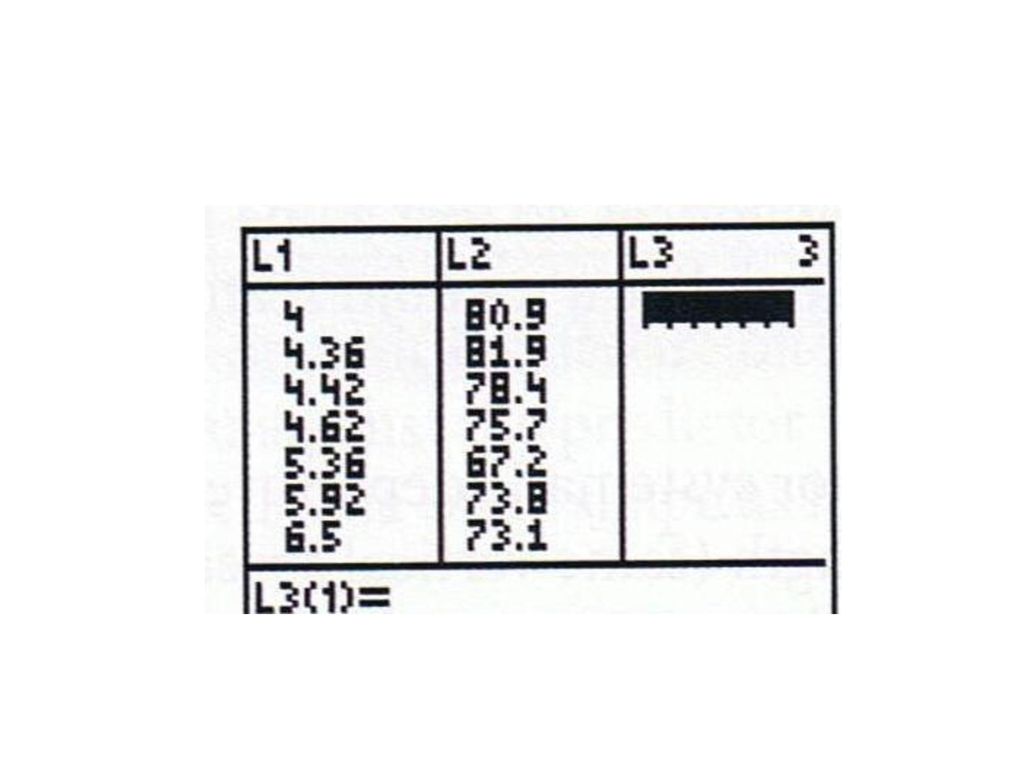
Create residual plot for this data.

74
Compute LSRL

75
To get RESID, select 2nd, LIST, 7: RESID

76
No obvious trends, so line is reasonable model for this data.

77
Questions?

Similar presentations


>")


 Explanatory Variable: helps explain or influences the change in the response.>")

 relationship: Determine the Explanatory and Response.>")


