Download presentation
Presentation is loading. Please wait.

1
Chapter 7 The Human Population

2
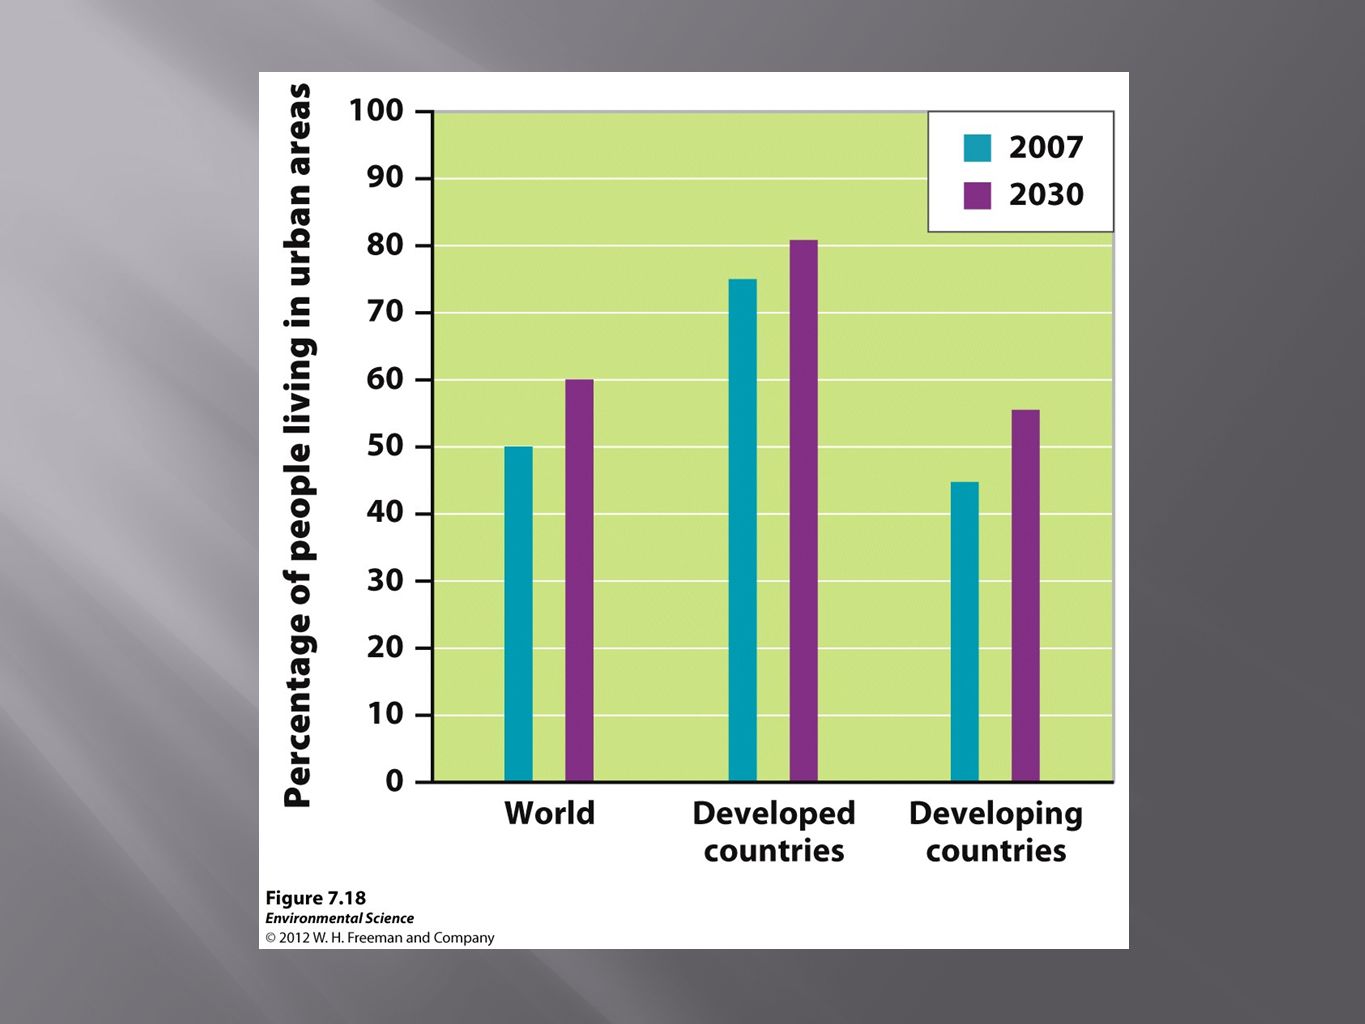
Figure 7.1

3
Scientists Disagree on Earth’s Carrying Capacity The following graphs show theoretical models of food supply and population size. The following graphs show theoretical models of food supply and population size.

4
Demography- the study of human populations and population trends. Changes in Population Size Fertility Life Expectancy Age Structure Migration

5
Immigration - the movement of people into a country Emigration - the movement of people out of a country. Net migration rate- the difference between immigration and emigration in a give year per 1,000 people in the country.

6
Demography Science of population structure and growth Human Population since 1980 is J-shaped curve

7
Human population reached: 1 billion around 1800 2 billion in 1930 3 billion in 1960 4 billion in 1975 5 billion in 1987 6 billion in 1999 7 billion in 2011

8
Population is increasing due to decrease in death rate, not increase in birth rate Greater food production Better medical care Improvements in water quality and sanitation Growth rate ( r ) has started to decline Will continue to decline until “zero population growth” S-curve may replace J-curve
 has started to decline Will continue to decline until zero population growth S-curve may replace J-curve")
9
Crude birth rate (CBR)= the number of births per 1,000 individuals per year. Crude death rate (CDR)= the number of deaths per 1,000 individuals per year. Global population growth rate = (CBR- CDR)/ 10 National population growth rate = (CBR+ immigration) - (CDR + emigration)/ 10 Doubling time (in years)- 70/growth rate
= the number of deaths per 1,000 individuals per year. Global population growth rate = (CBR- CDR)/ 10 National population growth rate = (CBR+ immigration) - (CDR + emigration)/ 10 Doubling time (in years)- 70/growth rate.")
10
Total Fertility Rate(TFR)- an estimate of the average number of children that each woman in a population will bear. Replacement level fertility- the total fertility rate required to offset the average number of deaths in a population and for the current population size to remain stable. Replacement level fertility- the total fertility rate required to offset the average number of deaths in a population and for the current population size to remain stable.

11
Developed countries- countries with relatively high levels of industrialization and income. Developing countries- countries with relatively low levels of industrialization and income of less that $3 per person per day.

12
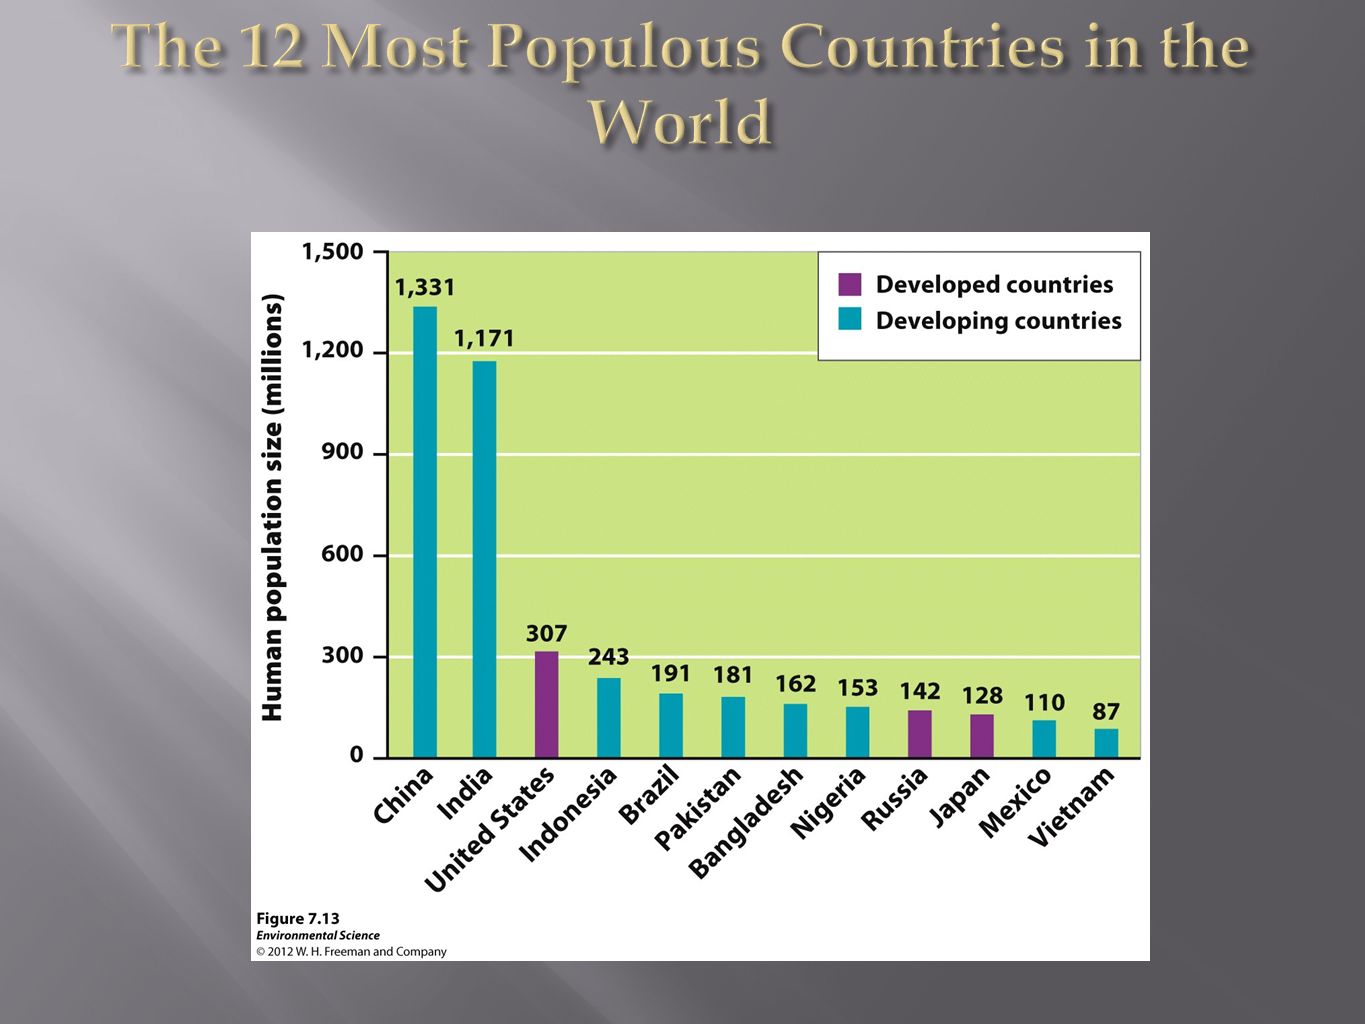
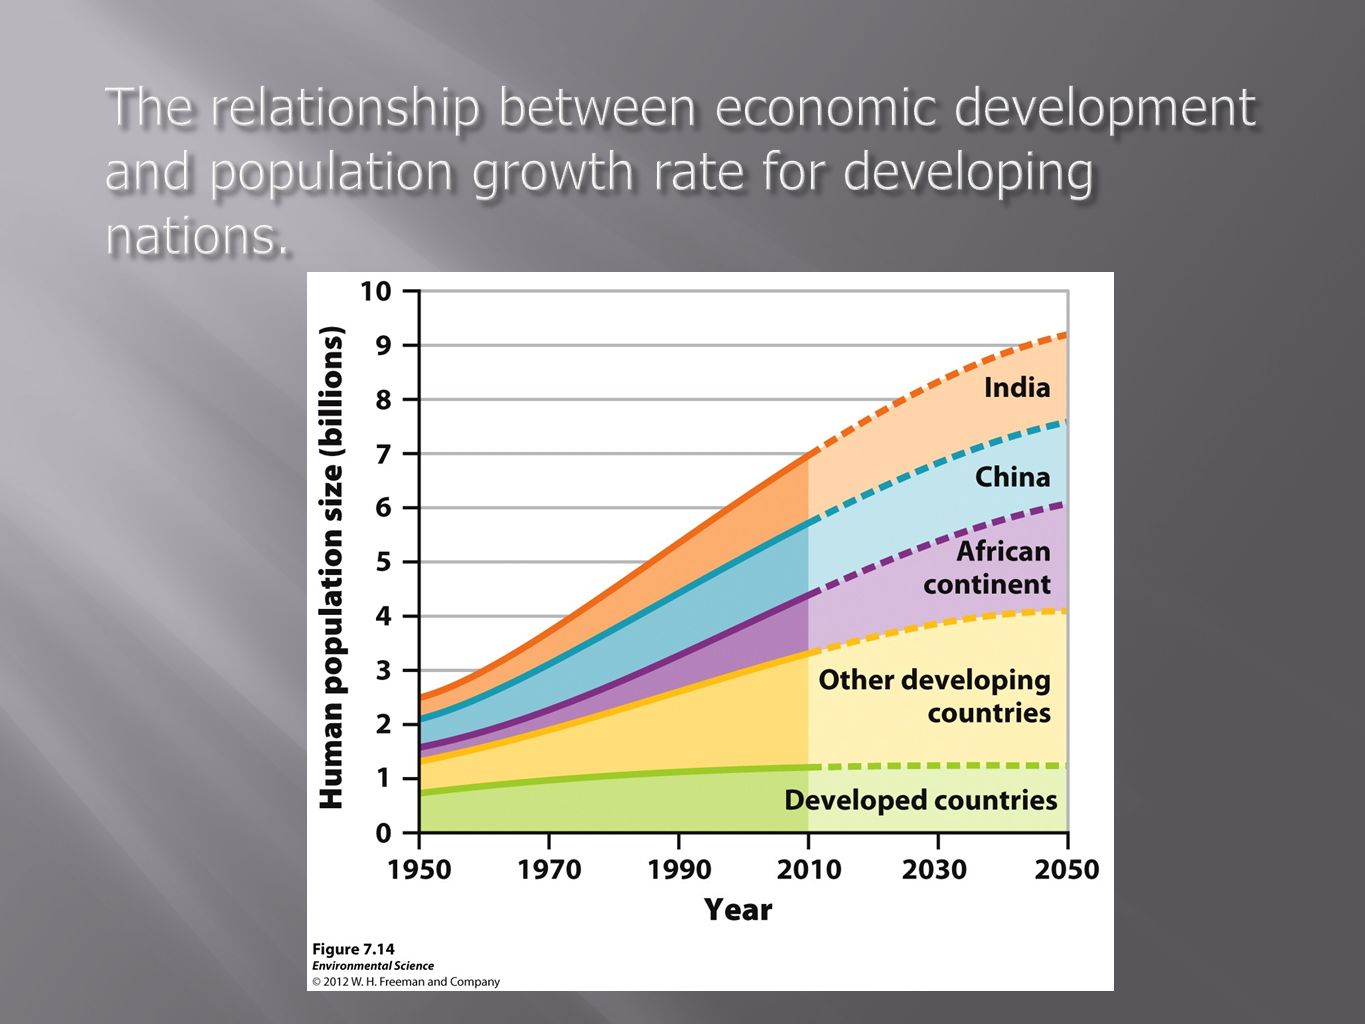
Population growth and population characteristics are not the same in all countries

13
Life expectancy- the average number of years that an infant born in a particular year in a particular country can be expected to live, given the current average life span and death rate of that country.

14
Infant mortality rate- the number of deaths of children under 1 year of age per 1,000 live births. Child mortality rate- the number of deaths of children under age 5 per 1,000 live births.

15
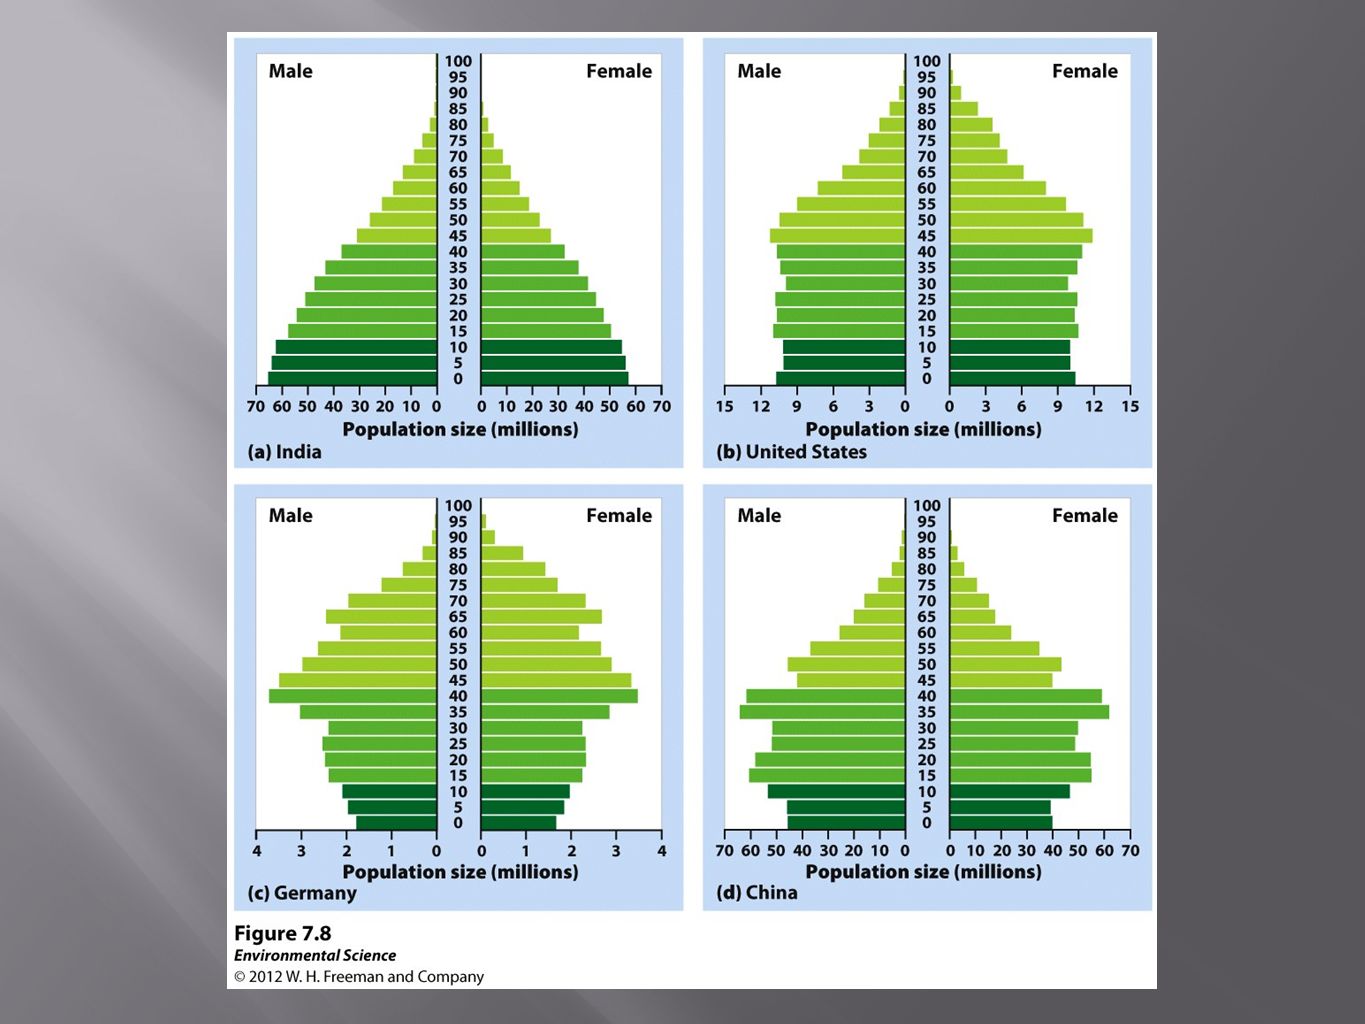
Age structure diagrams (population pyramids)- visual representations of age structure within a country for males and females.
- visual representations of age structure within a country for males and females.")
17
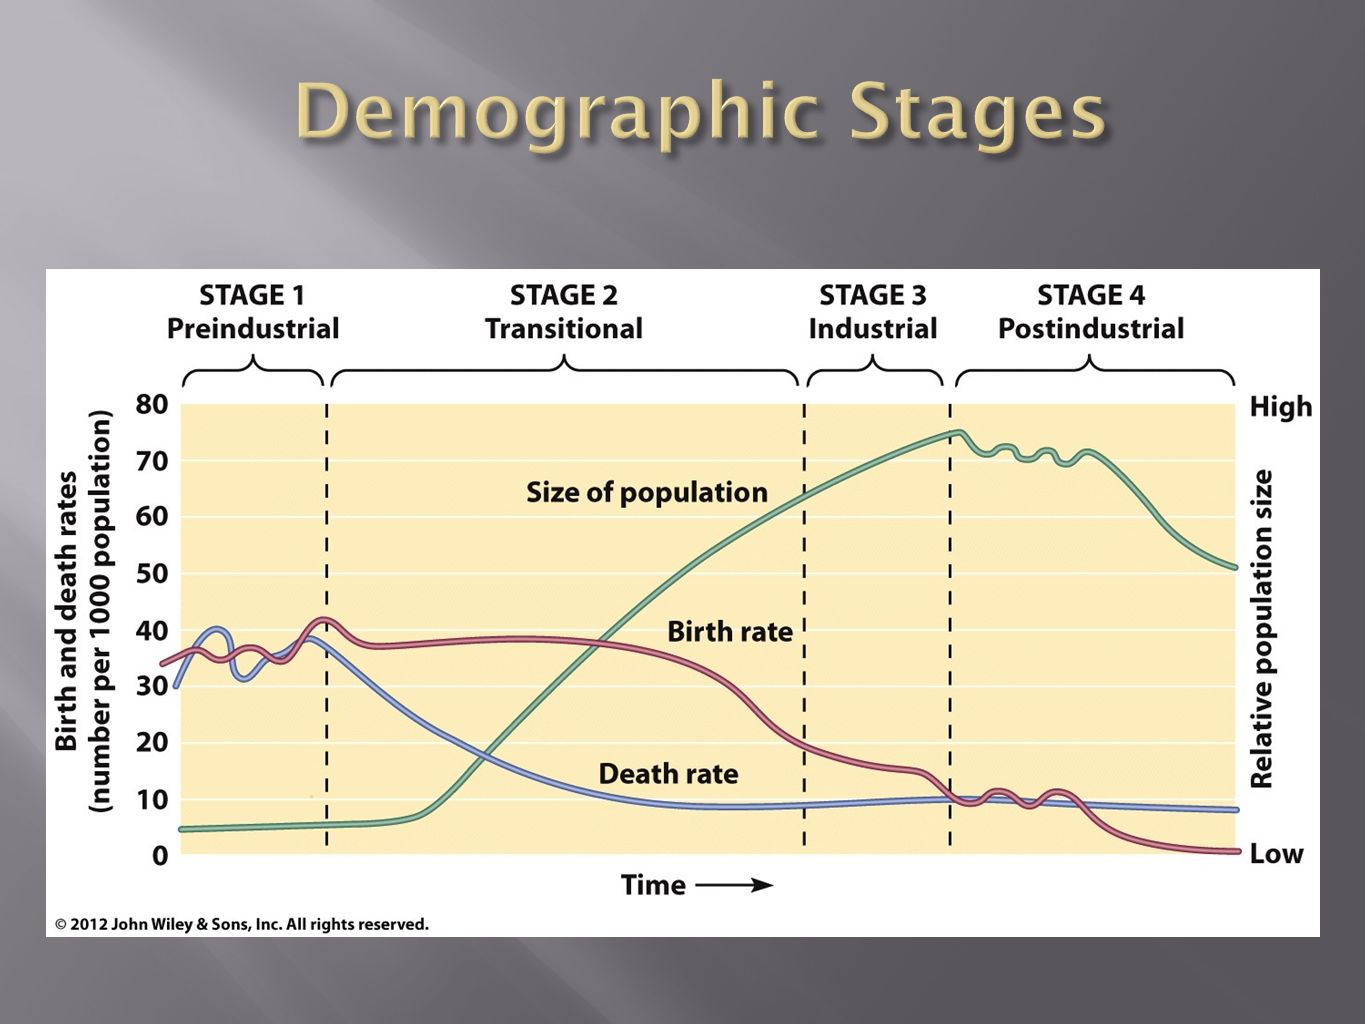
The theory of the demographic transition is the theory that as a country moves from a subsistence economy to industrialization and increased affluence, it undergoes a predictable shift in population growth.

18
Phase 1: Slow population growth because there are high birth rates and high death rates which offset each other. Phase 2: Rapid population growth because birth rates remain high but death rates decline due to better sanitation, clean drinking water, increased access to food and goods, and access to health care. Phase 3: Stable population growth as the economy and educational system improves and people have fewer children. Phase 4: Declining population growth because the relatively high level of affluence and economic develop encourage women to delay having children.

19
Pre-industrial Stage Birth and death rates high, modest population growth Transitional Stage Lowered death rate, rapid population growth Industrial Stage Birth rate decline, population growth slow Post Industrial Stage Low birth and death rates, population growth very slow

21
Family planning- the regulation of the number or spacing of offspring through the use of birth control.

22
Difficult to meet basic needs in developing countries Problems associated with overpopulation: Environmental degradation Hunger Persistent poverty Economic stagnation Urban deterioration Health issues

23
Food security Condition in which people do not live with chronic hunger and malnutrition Effects of Chronic Hunger Weakened immune system Illness and disease Malaria Measles Diarrhea Acute respiratory illness

24
Food insecurity Conditions under which people live with continuous threat of starvation Solving the Food Problem Control population growth Promote economic development of developing countries without adequate food supplies Provide access to food and land resources to those who live in areas without them

25
Two viewpoints from economists: Population growth stimulates economic development and technological innovation Rapid population expansion hampers developmental efforts Most observations support the second viewpoint In order for country to increase its standard of living, its economic growth must exceed its population growth

26
Three major influences on total fertility rate 1. Cultural traditions 2. Social & economic status of women 3. Family planning

27
Culture influences and controls individuals’ behaviors Marriage age Due to high infant and child mortality rates, couple is expected to have large number of children Children often work in family business (pictured left) Religious values
 Religious values")
28
Gender inequality is common worldwide Disparities Political participation Social status Economic status Health status Legal rights Education Employment and earnings Single most important factor affecting high total fertility rates is low status of women Illiteracy in 2002

29
Women with more education Marry later Have fewer children

30
Largest population in the world Controversial Family Planning Policy 1971 - Chinese Government actively pursued birth control 1979 - Incentives to promote later marriages and one- child families Medical care, schooling for child, preferential housing, retirement funds Brought about rapid and drastic decrease in fertility

31
1979- plan put in place with incentives to promote later marriages and one-child families Incentives were medical care, schooling for child, cash bonuses, preferential housing, retirement funds If second child was born, all incentives must be revoked or returned Decrease in fertility from 5.8 births per woman to 2.1 birth per woman in 1981

32
Plan was controversial and unpopular Social pressure to abort a second child Pressure to abort/kill female first child 120 boys to 100 girls as of 2000 Plan much more relaxed in rural China 2011 TFR = 1.5

33
Young age structure Huge potential for population growth: 29% of population is under age 15 High Population Growth Momentum 1974 - government imparted educational reform, family planning, health care Very successful TFR dropped from 6.7 (1970) to 2.3 (2011)
 to 2.3 (2011)")
36
Affluence - having a lot of wealth such as money, goods, or property. To estimate the impact of human lifestyles on Earth we can use the IPAT equation: I mpact= P opulation X A ffluence X T echnology (technological impact)
.")
39
Gross domestic product (GDP)- the value of all products and services produced in a year in that country. GDP is made up of consumer spending, investments, government spending, and exports minus imports. A countries GDP often correlates with its pollution levels.

Similar presentations


>")


