Download presentation
Presentation is loading. Please wait.

1
PLANNING FOR PUBLIC TRANSPORTATION AND LAND-USE Module 3, Lesson 5

2
Learning Objectives Explain the Transportation and Land-Use Connection Describe the history of Transportation and Urban Development Examine the costs of Sprawl Discuss pedestrian-friendly design and Transit Oriented Development

3
Overall Context Places a focus on the interdependence between the transportation and land-use systems through a discussion of the history of urban transport and urban development, and the costs of sprawl. Transit Oriented Development is examined as a solution to combat urban sprawl and promote walking, cycling, and public transportation.

4
The Transportation and Land Use Connection Source: adapted from Giuliano (2005) Transportation Accessibility Land Use Activity Pattern
 Transportation Accessibility Land Use Activity Pattern")
5
Potential Land Use Responses to Transit Investments

6
Spatial Evolution of U.S. Metropolitan Areas: One Hour Commuting Distance and Different Transportation Modes (1) Walking-horsecar era (1800-1890) Pedestrian walking speed is about at 5 km/h. A circle of about 10 km around the city center could be reached within this time. (2) Streetcar era (1890-1920) Travel speed is around 15 km per hour along fixed lines. (3) Automobile era (1920-1945) Driving (without freeways) at about 30 km/h. (4) The highway era (1945-now). Driving (with freeways). Along freeways 60 km/h are possible Source: Adapted from Rodriguez 2005, Mueller, 2005 1234 Transit line Urban highway
 Walking-horsecar era ( ) Pedestrian walking speed is about at 5 km/h. A circle of about 10 km around the city center could be reached within this time. (2) Streetcar era ( ) Travel speed is around 15 km per hour along fixed lines. (3) Automobile era ( ) Driving (without freeways) at about 30 km/h. (4) The highway era (1945-now). Driving (with freeways). Along freeways 60 km/h are possible Source: Adapted from Rodriguez 2005, Mueller, Transit line Urban highway.")
7
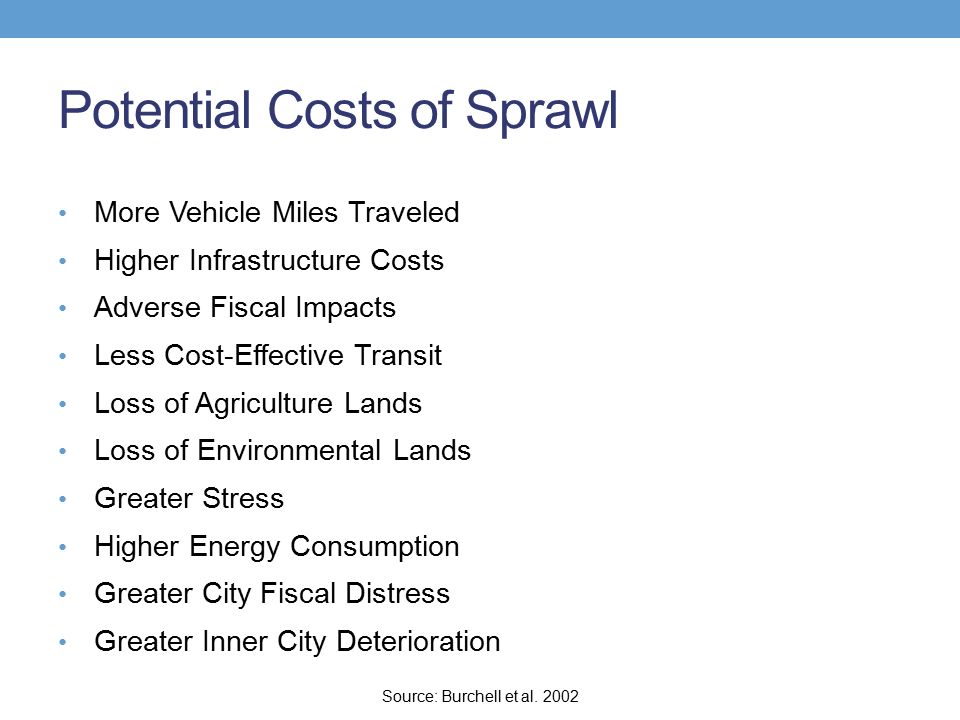
Potential Costs of Sprawl More Vehicle Miles Traveled Higher Infrastructure Costs Adverse Fiscal Impacts Less Cost-Effective Transit Loss of Agriculture Lands Loss of Environmental Lands Greater Stress Higher Energy Consumption Greater City Fiscal Distress Greater Inner City Deterioration Source: Burchell et al. 2002
8
Empirical Evidence: Weighted Average Elasticities of Transit Use with Respect to Built Environment Variables Source: Ewing and Cervero, 2010

9
Transit at Destination and Origin Source: Cervero/TRB, 2005

10
Pedestrian-Friendly Characteristics Attention to Detail Accessibility Comfort/Safety Human Scale Definition/Visual Enclosure Linkage Complexity/Intricacy Coherence/Order Transparency/Human Presence Sense of Place/Identity Source: Ewing 1999

11
Transit Oriented Development (TOD) “An environment around a transit stop or station that supports pedestrian and transit use, created by providing a mix of land uses in a safe, clean, vibrant, and active place.” (New Jersey DOT) “Is a mix of housing, retail and/or commercial development and amenities – typically referred to as mixed-use development – integrated into walkable neighborhoods within a half-mile of quality public transportation.” ( Reconnecting America)
 An environment around a transit stop or station that supports pedestrian and transit use, created by providing a mix of land uses in a safe, clean, vibrant, and active place. (New Jersey DOT) Is a mix of housing, retail and/or commercial development and amenities – typically referred to as mixed-use development – integrated into walkable neighborhoods within a half-mile of quality public transportation. ( Reconnecting America)")
12
Transit Oriented Development (TOD) “Moderate- to higher-density development, located within an easy walk of a major transit stop, generally with a mix of residential, employment, and shopping opportunities designed for pedestrians without excluding the automobile. TOD can be new construction or redevelopment of one or more buildings whose design and orientation facilitate transit use. “ (California DOT) Transit oriented development (TOD) generally refers to higher-density development, with pedestrian priority, located within easy walking distance of a major public transit station or stop(s). (TCRP Report 95)
 Transit oriented development (TOD) generally refers to higher-density development, with pedestrian priority, located within easy walking distance of a major public transit station or stop(s). (TCRP Report 95).")
13
Potential Benefits of TOD Reduced household driving and thus lowered regional congestion, air pollution and greenhouse gas emissions Walkable communities that accommodate more healthy and active lifestyles Increased transit ridership and fare revenue Potential for added value created through increased and/or sustained property values where transit investments have occurred Improved access to jobs and economic opportunity for low- income people and working families Expanded mobility choices that reduce dependence on the automobile, reduce transportation costs and free up household income for other purposes Sources: Reconnecting America

14
A Taxonomy of TODs I Source: Reconnecting America & CTOD. 2008. Station Area Planning. How To Make Great Transit-Oriented Places. TOD 202.

15
A Taxonomy of TODs Continued Source: Reconnecting America & CTOD. 2008. Station Area Planning. How To Make Great Transit-Oriented Places. TOD 202.

16
Planning for TOD at 3 Different Scales Station Area Scale Corridor Scale Regional Scale Source: Reconnecting America 2010. Station Area Planning.

17
Planning Fundamentals For TOD 1. Maximize ridership through appropriate development. 2. Generate meaningful community involvement. 3. Design streets for all users. 4. Create opportunities for affordable and accessible living. 5. Make great public spaces. 6. Manage parking effectively. 7. Capture the value of transit. 8. Maximize neighborhood and station connectivity. 9. Implement the plan and evaluate its success. Source: American Planning Association (http://www.planning.org/pas/brochure/pdf/quicknotes.pdf

18
Development Guidelines by Type of TOD I Source: Reconnecting America & CTOD. 2008. Station Area Planning. How To Make Great Transit-Oriented Places. TOD 202.

19
Development Guidelines by Type of TOD II Source: Reconnecting America & CTOD. 2008. Station Area Planning. How To Make Great Transit-Oriented Places. TOD 202.

20
A TOD Residential Building Typology Source: Reconnecting America & CTOD. 2008. Station Area Planning. How To Make Great Transit-Oriented Places. TOD 202.

21
A TOD Mixed Use/Employment Building Typology Source: Reconnecting America & CTOD. 2008. Station Area Planning. How To Make Great Transit-Oriented Places. TOD 202.

22
A TOD Open Space Typology Source: Reconnecting America & CTOD. 2008. Station Area Planning. How To Make Great Transit-Oriented Places. TOD 202.

23
Empirical Findings: TOD, Travel Behavior, Land Use, and Transit System TOD commuters typically use transit two to five times more than other commuters; TOD transit commute share can vary from 5% to near 50% Transit share of all trips in TOD is two to five times higher than outside TOD, but mode shares only 2% to 20% Transit system extensiveness and level of service are positively correlated with transit ridership; Transit service headways of 10 minutes seem to support a transit lifestyle, For commutes, proximity to rail stations is a stronger influence on transit use than land use or quality of walking environment. Location of jobs accessible by transit influences ridership Factors that most influence transit ridership are station proximity, transit quality, and parking policies. Fast, frequent, and comfortable transit service will increase ridership, as will high parking charges and/or constrained parking supply The availability of free or low-cost parking is a major deterrent to transit ridership Source: TCRP Report 128

24
However, it remains difficult to isolate the effect of TOD empirically, because of…. Many confounding factors Long time horizons Residential self-selection Generative or redistributive benefits Negative impacts on property values (e.g. noise) Network aspect of location of TOD Source: TCRP Report 128, Curtis et al. 2010.
 Network aspect of location of TOD Source: TCRP Report 128, Curtis et al")
25
Comparison of TOD housing and ITE vehicle trip generation rates (24 hour estimates)
")
26
Impediments to TOD by Stakeholder Group TCRP Report 102

27
Potential Government Support for TOD Federal: Legislation (e.g. New Starts, Transportation and Community and Systems Preservation Pilot Program); Center for Transit-Oriented Development; Funding for state and regional planning. States: Promote regional and state-wide coordination; Provide financial incentives; Remove regulatory and statutory barriers to land use; Provide planning, policy research, technical assistance, and information for municipalities; Pilot programs. TCRP Report 102
; Center for Transit-Oriented Development; Funding for state and regional planning. States: Promote regional and state-wide coordination; Provide financial incentives; Remove regulatory and statutory barriers to land use; Provide planning, policy research, technical assistance, and information for municipalities; Pilot programs. TCRP Report 102.")
28
Potential Government Support for TOD Regional Promote regional coordination for transportation and land-use planning; Provide financial incentives; Setting regional visions and policy goals. Local: Zoning (reduced parking, mixed use, minimum densities, density bonuses, overlay zones); Planning; Reduced Fees; Siting Government Facilities. TCRP Report 102
; Planning; Reduced Fees; Siting Government Facilities. TCRP Report 102.")
29
Possible Roles for the Transit Agency in Support for TOD Brokers, facilitators, educators Funders, active development partners Advocates Land and land assembly Infrastructure investment Shared parking Direct financial participation TCRP Report 102

30
Suggested Readings Arrington, G.B., Cervero, R. 2008. TCRP Report 128: Effects of TOD on Housing Parking and Travel. National Academies, Transportation Research Board, Transit Cooperative Research Program, Washington, D.C. (available online, read summary only, pp. 1-5) Burchell, R., Lowenstein, G., Dolphin, W.R., Galley, C., 2002. Costs of sprawl 2000, TCRP Report 74. Transportation Research Board. National Academy Press, Washington D.C. (available online, read executive summary only, pp. 1- 20) Ewing, R., Cervero, R., 2010. Travel and the Built Environment: A Meta Analysis. Journal of the American Planning Association 76(3), 265 - 294. Polzin, S. 1999. Transportation/Land-use Relationship: Public Transit’s Impact on Land Use. ASCE Journal of Urban Planning and Development, December 1999, pp. 135-151. TRB, 2001. Making transit work: Insight from Western Europe, Canada and the United States. Transportation Research Board, National Research Council, National Academy Press, Washington DC. (available online, read chapter 2 only).
 Burchell, R., Lowenstein, G., Dolphin, W.R., Galley, C., Costs of sprawl 2000, TCRP Report 74. Transportation Research Board. National Academy Press, Washington D.C. (available online, read executive summary only, pp ) Ewing, R., Cervero, R., Travel and the Built Environment: A Meta Analysis. Journal of the American Planning Association 76(3), Polzin, S Transportation/Land-use Relationship: Public Transit’s Impact on Land Use. ASCE Journal of Urban Planning and Development, December 1999, pp TRB, Making transit work: Insight from Western Europe, Canada and the United States. Transportation Research Board, National Research Council, National Academy Press, Washington DC. (available online, read chapter 2 only)..")
31
More Resources Arrington, G.B., Cervero, R. 2008. TCRP Report 128: Effects of TOD on Housing Parking and Travel. National Academies, Transportation Research Board, Transit Cooperative Research Program, Washington, D.C. Black, A., 1995. Urban Mass Transportation Planning. McGraw-Hill, New York City. Burchell, R., Lowenstein, G., Dolphin, W.R., Galley, C., 2002. Costs of sprawl 2000, TCRP Report 74. Transportation Research Board. National Academy Press, Washington D.C. Curtis, C., Renne J., Bertolini, L., 2009. Transit Oriented Development: Making It Happen. Ashgate Publishing, Burlington. Cervero, R., Ferrell, C., Murphy, S. 2002. Transit-Oriented Development and Joint Development in the United States: A Literature Review. National Academies, Transportation Research Board, Transit Cooperative Research Program, Washington, D.C. Cervero et al. 2004. TCRP Report 102: Transit Oriented Development in the United States-Experiences, Challenges, and Prospects. National Academies, Transportation Research Board, Transit Cooperative Research Program, Washington, D.C. Ewing, R., Cervero, R., 2001. Travel and the built environment. A synthesis. Transportation Research Record 1780. Ewing, R., Cervero, R., 2010. Travel and the Built Environment: A Meta Analysis. J. Am. Plann. Assoc. 76(3), 265 - 294. Ewing, R., 1999. Pedestrian- and Transit-Friendly Design: A Primer for Smart Growth. Smart Growth Network, Washington, D.C.
, Ewing, R., Pedestrian- and Transit-Friendly Design: A Primer for Smart Growth. Smart Growth Network, Washington, D.C..")
32
More Resources Handy, S. 2005. “Smart growth and the transportation - Land use connection: What does the research tell us?” International Regional Science Review. 28 (2), pp. 146-167. Hanson, S., Giuliano, G., 2004. The geography of urban transportation, 3rd ed. The Guilford Press, New York. Moore, T., Thorsnes, P., Appleyard, B., 2007. The Transportation/Land Use Connection. American Planning Association, Chicago. Muller, P.O., 2004. Transportation and urban form: Stages in the evolution of the American metropolis, In: Hanson, S., Giuliano, G. (Eds.), The geography of urban transportation. Guilford Publications, New York. Polzin, S. 1999. Transportation/Land-use Relationship: Public Transit’s Impact on Land Use. Journal of Urban Planning and Development, December 1999, pp. 135-151. Reconnecting America, 2008. TOD 202 Station Area Planning. Reconnecting America/ Center for Transit Oriented Development. Reconnecting America, 2010. TOD 203 Transit Corridors and TOD. Reconnecting America/ Center for Transit Oriented Development. Reconnecting America, 2011. TOD 204 Planning for TOD at the Regional Scale. Reconnecting America/ Center for Transit Oriented Development. TRB, 2001. Making transit work: Insight from Western Europe, Canada and the United States. Transportation Research Board, National Research Council, National Academy Press, Washington DC. Vuchic, V., 1999. Transportation for livable cities. Center for Urban Policy Research (CUPR), New Brunswick, NJ.
, pp Hanson, S., Giuliano, G., The geography of urban transportation, 3rd ed. The Guilford Press, New York. Moore, T., Thorsnes, P., Appleyard, B., The Transportation/Land Use Connection. American Planning Association, Chicago. Muller, P.O., Transportation and urban form: Stages in the evolution of the American metropolis, In: Hanson, S., Giuliano, G. (Eds.), The geography of urban transportation. Guilford Publications, New York. Polzin, S Transportation/Land-use Relationship: Public Transit’s Impact on Land Use. Journal of Urban Planning and Development, December 1999, pp Reconnecting America, TOD 202 Station Area Planning. Reconnecting America/ Center for Transit Oriented Development. Reconnecting America, TOD 203 Transit Corridors and TOD. Reconnecting America/ Center for Transit Oriented Development. Reconnecting America, TOD 204 Planning for TOD at the Regional Scale. Reconnecting America/ Center for Transit Oriented Development. TRB, Making transit work: Insight from Western Europe, Canada and the United States. Transportation Research Board, National Research Council, National Academy Press, Washington DC. Vuchic, V., Transportation for livable cities. Center for Urban Policy Research (CUPR), New Brunswick, NJ..")
33
Walkability Assignment About 80% of passengers access public transportation on foot. For this assignment you will grade the streets/built environment adjacent to a public transportation station (or hub) according to pedestrian friendly design criteria. You can choose a station/hub close to your campus or you can use online software with street view features (e.g. google maps or bing maps) to access stations elsewhere in the United States. You should employ pedestrian friendly design criteria introduced during today’s lecture and/or some of those listed in the reading by Reid Ewing (see link below). First, you should develop your own tool to measure walkability/transit accessibility. Criteria can include: human scale (signs, height to width ratio), buffering (trees, parking distance to street), street furniture, space (wide, long views, complex scenes), etc. Once the tool is developed you should score the street(s) close to the transit stop on all of your indicators on a scale from 1 to 5 (5 is best). You can evaluate the street in person or via street view features of google, bing, or others.
 according to pedestrian friendly design criteria. You can choose a station/hub close to your campus or you can use online software with street view features (e.g. google maps or bing maps) to access stations elsewhere in the United States. You should employ pedestrian friendly design criteria introduced during today’s lecture and/or some of those listed in the reading by Reid Ewing (see link below). First, you should develop your own tool to measure walkability/transit accessibility. Criteria can include: human scale (signs, height to width ratio), buffering (trees, parking distance to street), street furniture, space (wide, long views, complex scenes), etc. Once the tool is developed you should score the street(s) close to the transit stop on all of your indicators on a scale from 1 to 5 (5 is best). You can evaluate the street in person or via street view features of google, bing, or others..")
34
Walkability Assignment Deliverables: Measurement instrument for pedestrian friendly design. In a short write-up you should explain how your measurement instrument works; this includes connections between constructs (e.g. buffering from car traffic) and measurements (e.g. spacing of street trees, presence of parked cars). Overall and criterion score for the street(s) (ideally with pictures or screenshots from the street). Short text summarizing your justification for the score given to the street(s). This text should explain why you decided to give your score; this should ideally be connected to the readings or class discussion. Excel table summarizing your individual scores of the streets. Suggestions for (realistic) improvements for the street for more pedestrian friendliness. Evaluation of the performance of your tool (1 or 2 paragraphs). What were the problems? How would you improve it? Note: you can work in groups to develop the tool, analyze the results, and write the text. However, each student has to score the street(s) him or herself. Groups should then present average scores across all group members and indicate potential diverging scores across group members. Link to the Ewing (1999) text: http://www.epa.gov/smartgrowth/pdf/ptfd_primer.pdf
 and measurements (e.g. spacing of street trees, presence of parked cars). Overall and criterion score for the street(s) (ideally with pictures or screenshots from the street). Short text summarizing your justification for the score given to the street(s). This text should explain why you decided to give your score; this should ideally be connected to the readings or class discussion. Excel table summarizing your individual scores of the streets. Suggestions for (realistic) improvements for the street for more pedestrian friendliness. Evaluation of the performance of your tool (1 or 2 paragraphs). What were the problems. How would you improve it. Note: you can work in groups to develop the tool, analyze the results, and write the text. However, each student has to score the street(s) him or herself. Groups should then present average scores across all group members and indicate potential diverging scores across group members. Link to the Ewing (1999) text:")
35
Walkability Tool Example

36
Links Rail~Volution: http://www.railvolution.org/http://www.railvolution.org/ CTOD (Center for Transit Oriented Development): http://www.ctod.org/ http://www.ctod.org/ Reconnecting America: http://reconnectingamerica.org/
: Reconnecting America:")
37
Sources:

Similar presentations


