Download presentation
Presentation is loading. Please wait.

1
GEOMETRIC DESIGN OF HIGHWAYS FOR READING AASHTO GREEN BOOK CHAPTER 3

2
The alignment of a highway is composed of horizontal and vertical elements The horizontal alignment includes the straight (tangent) sections of the roadway and the circular curves that connect their change in direction The vertical alignment includes straight (tangent) highway grades and the parabolic curves that connect these grades Highway alignment is in reality a three- dimensional problem Design & construction is difficult in 3-D so highway design is typically treated as two 2-D problems: Horizontal alignment, vertical alignment Geometric design of highways
 sections of the roadway and the circular curves that connect their change in direction The vertical alignment includes straight (tangent) highway grades and the parabolic curves that connect these grades Highway alignment is in reality a three- dimensional problem Design & construction is difficult in 3-D so highway design is typically treated as two 2-D problems: Horizontal alignment, vertical alignment Geometric design of highways")
3
Horizontal Alignment Corresponds to “X” and “Z” Coordinates Plan view – Roughly equivalent to the perspective of an aerial photograph of highway Vertical Alignment Corresponds to highway length and “Y” Coordinate Presented in a profile view Gives elevation of all points measured along the length of a highway Horizontal Alignment Vertical Alignment Geometric design of highways PLAN PROFILE

4
Horizontal Alignment Horizontal Curves: curves used in horizontal planes to connect two straight tangent sections Simple Curve: circular arc connecting two tangents Compound Curve: a curve which is composed of two or more circular arcs of different radii, with centers on the same side of the alignment Compound curves are used to fit horizontal curves to very specific alignment needs …..interchange ramps, intersection curves etc. Radii should not be very different- difficult for drivers to maintain lane position as they transition from one to another curve

5
Horizontal Alignment Spiral Curve: A curve with constantly changing radius. A curve whose radius decreases uniformly from infinity at the tangent to that of the curve it meets. Motorist usually create their own transition path while moving from tangent section to curve….spiral curves not often used Special case use: used to gradually introduce super elevation Broken-Back Curve: the combination of short length of tangent (less than 100 ft) connecting two circular arcs that have centers on the same side Reverse Curve: Two circular arcs tangent to each other, with their centers on opposite sides of the alignment
 connecting two circular arcs that have centers on the same side Reverse Curve: Two circular arcs tangent to each other, with their centers on opposite sides of the alignment.")
6
Horizontal Alignment

7
Properties of Circular Curve Degree of Curvature Traditionally, the “steepness” of the curvature is defined by either the radius (R) or the degree of curvature (D) In highway work we use the ARC definition Degree of curvature = angle subtended by an arc of length 100 feet
 or the degree of curvature (D) In highway work we use the ARC definition Degree of curvature = angle subtended by an arc of length 100 feet")
8
As the subtended arc is proportional to the radius of the circle, then the radian measure of the angle Is the ratio of the length of the subtended arc to the radius of the circle Properties of Circular Curve

9
Horizontal curve Fundamentals Length of Curve: The length of the curve derives directly from the arc definition of degree of curvature A central angle equal to the degree of curvature subtends an arc of 100 ft, while the actual central angle (Δ) subtends the length of the curve (L). By simple ratio D/100=Δ/L L = 100 Δ / D Radius of Curve R=5730/D(R in feet) R=1718.87/D (R in meters)
 R= /D (R in meters).")
10
Horizontal curve Fundamentals R = Radius of Circular Curve (ft) PC = Point of Curvature (Beginning of Curve) PT = Point of Tangency (End of Curve) PI = Point of Intersection T = Tangent Length (T = PI – PC) L = Length of Curvature (L = PT– PC) M = Middle Ordinate E = External Distance L.C = Chord Length Δ = Deflection Angle or external angle
 PC = Point of Curvature (Beginning of Curve) PT = Point of Tangency (End of Curve) PI = Point of Intersection T = Tangent Length (T = PI – PC) L = Length of Curvature (L = PT– PC) M = Middle Ordinate E = External Distance L.C = Chord Length Δ = Deflection Angle or external angle")
11
Horizontal curve Fundamentals

12
Horizontal curve example 1 A horizontal curve is designed with a 2000-ft radius. The curve has a tangent length of 400 ft. and the PI is at station 103 + 00. Determine the stationing of PT

13
Horizontal curve example 2 Two tangent lines meet at Station 3,200 + 15. The radius of curvature is 1,200 ft, and the angle of deflection is 14". Find the length of the curve, the stations for the P.C. and P.T, and all other relevant characteristics of the curve (L.C., M, E).
..")
14
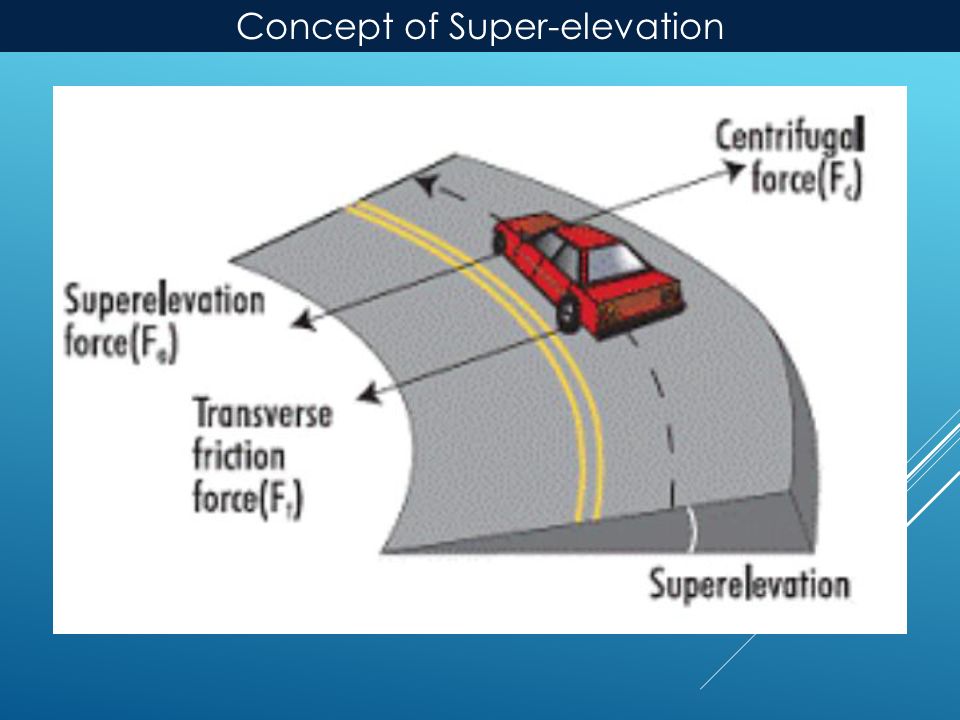
Horizontal Alignment Super-elevation (e) Super elevation is the amount of cross slope or "bank" provided on a horizontal curve to help counterbalance the outward pull of a vehicle traversing the curve. The maximum rate of super elevation (e max ) depends on several factors including climatic conditions, terrain conditions and type of area (rural or urban).
 depends on several factors including climatic conditions, terrain conditions and type of area (rural or urban)..")
15
Concept of Super-elevation Centrifugal force and Centripetal Forces Centrifugal force (Latin for "center fleeing") describes the tendency of an object following a curved path to fly outwards, away from the center of the curve. It's not really a force; it results from inertia i.e. the tendency of an object to resist any change in its state of rest or motion Example: Mud flying off a tire; children pushed out on a roundabout Centripetal force is a "real" force that counteracts the centrifugal force and prevents the object from "flying out", keeping it moving instead with a uniform speed along a circular path Example: Satellite orbiting a planet

16
Concept of Super-elevation

18
SUPERELEVATION Road Plan View Road Section View CL 2% Concept of Super-elevation

19
SUPERELEVATION Road Plan ViewRoad Section View CL 2% 1.5% Concept of Super-elevation

20
SUPERELEVATION Road Plan ViewRoad Section View CL 2% 1% Concept of Super-elevation

21
SUPERELEVATION Road Plan ViewRoad Section View CL 2% 0.5% Concept of Super-elevation

22
SUPERELEVATION Road Plan ViewRoad Section View CL 2% -0.0% Concept of Super-elevation

23
SUPERELEVATION Road Plan View Road Section View CL 2% -0.5% Concept of Super-elevation

24
SUPERELEVATION Road Plan ViewRoad Section View CL 2% -1% Concept of Super-elevation

25
-.5% SUPERELEVATION Road Plan ViewRoad Section View CL 2% Concept of Super-elevation

26
SUPERELEVATION Road Plan ViewRoad Section View 2% -2% CL Concept of Super-elevation

27
SUPERELEVATION Road Plan ViewRoad Section View 3% -3% CL Concept of Super-elevation

28
SUPER ELEVATION Road Plan View Road Section View 4% -4% CL Concept of Super-elevation

29
SUPERELEVATION Road Plan ViewRoad Section View 3% -3% CL Concept of Super-elevation

30
SUPERELEVATION Road Plan ViewRoad Section View 2% -2% CL Concept of Super-elevation

31
SUPERELEVATION Road Plan ViewRoad Section View 2% CL -1.5% Concept of Super-elevation

32
SUPERELEVATION Road Plan ViewRoad Section View 2% CL -1% Concept of Super-elevation

33
SUPERELEVATION Road Plan ViewRoad Section View 2% CL -0.5% Concept of Super-elevation

34
SUPERELEVATION Road Plan ViewRoad Section View 2% CL -0.0% Concept of Super-elevation

35
SUPERELEVATION Road Plan ViewRoad Section View 2% CL 0.5% Concept of Super-elevation

36
SUPERELEVATION Road Plan ViewRoad Section View 2% CL 1% Concept of Super-elevation

37
SUPERELEVATION Road Plan ViewRoad Section View 2% CL 1.5% Concept of Super-elevation

38
SUPERELEVATION Road Plan ViewRoad Section View 2% CL 2% Concept of Super-elevation

39
P = centrifugal force acting horizontally out-wards through the center of gravity W = weight of the vehicle acting down-wards through the center of gravity F = friction force between the wheels and the pavement, along the surface inward

40
Concept of Super-elevation At equilibrium, by resolving the forces parallel to the surface of pavement Pcosθ=Wsin θ+ F A +F b =Wsin θ+f(Wcos θ+Psin θ) where W is the weight of the vehicle, P is the centrifugal force, f is the coefficient of friction, is the transverse slope due to super elevation Dividing by WCos θ and rearranging we get
 where W is the weight of the vehicle, P is the centrifugal force, f is the coefficient of friction, is the transverse slope due to super elevation Dividing by WCos θ and rearranging we get")
41
Concept of Super-elevation f=side friction factor e=super elevation

42
Side friction factor Lateral Friction between the tyre of the vehicle and the pavement surface on the horizontal curve. Factors affecting side friction factor: Speed of the vehicle (f decreases as speed increases (less tire/pavement contact)) The type and condition of the roadway surface Type and condition of the vehicle tires Design values represent wet pavements and tires in reasonable but not top condition Values also represent frictional forces that can be comfortably achieved; they do not represent, for example, the maximum side friction that is achieved the instant before skidding Design values for the coefficient of side friction (f) vary with speed from 0.38 at 10 mph to 0.08 at 80 mph
) The type and condition of the roadway surface Type and condition of the vehicle tires Design values represent wet pavements and tires in reasonable but not top condition Values also represent frictional forces that can be comfortably achieved; they do not represent, for example, the maximum side friction that is achieved the instant before skidding Design values for the coefficient of side friction (f) vary with speed from 0.38 at 10 mph to 0.08 at 80 mph.")
43
Side friction factor

45
Super elevation Example 1 A roadway is being designed for a speed of 70 mi/h. At horizontal curve, it is known that the super elevation is 8.0% and the coefficient of side friction is 0.10. Determine the minimum radius of curve (measured to the traveled path) that will provide for safe vehicle operation.
 that will provide for safe vehicle operation..")
46
Super elevation Example 2 Determine the proper super elevation rate for an urban highway with a design speed of 50 mph and degree of curvature of 8 degrees

47
Super elevation Example 3 A 1.0-km long racetrack is to be designed with turns 250 m in length at each end. Determine the super elevation rate you would recommend for a design speed of 130 km/h.

48
Maximum Super elevation The maximum rates of superelevation used on highways are controlled by four factors: Climate conditions: (i.e., frequency and amount of snow and ice) Terrain conditions (i.e., flat, rolling, or mountainous) Type of area (i.e., rural or urban) Frequency of very slow-moving vehicles whose operation might be affected by high super elevation rates Consideration of these factors jointly leads to the conclusion that no single maximum super elevation rate is universally applicable However, using only one maximum super elevation rate within a region of similar climate and land use is desirable, as such a practice promotes design consistency
 Terrain conditions (i.e., flat, rolling, or mountainous) Type of area (i.e., rural or urban) Frequency of very slow-moving vehicles whose operation might be affected by high super elevation rates Consideration of these factors jointly leads to the conclusion that no single maximum super elevation rate is universally applicable However, using only one maximum super elevation rate within a region of similar climate and land use is desirable, as such a practice promotes design consistency")
49
Maximum Super elevation AASHTO recommends the use of maximum super elevation rates between 4% and 12%. For design purposes, only increments of 2% are used Maximum rates adopted vary from region to region based upon factors such as climate, terrain, development density, and frequency of slow-moving vehicles. Some of the practical considerations involved in setting this range, and for selection of an appropriate rate include: Twelve percent (12%) is the maximum super elevation rate in use. Drivers feel uncomfortable on sections with higher rates, and driver effort to maintain lateral position is high when speeds are reduced on such curves Where snow and ice are prevalent, a maximum value of 8% is generally used. Many agencies use this as an upper limit regardless, due to the effect of rain or mud on highways. Ice on the road can reduce friction force and vehicle travelling at less than the design speed on the excessively superelevated curve slide inward off the curve due to gravitational forces. In urban areas, where speeds may be reduced frequently due to congestion, maximum rates of 4%-6% are often used On low-speed urban streets or at intersections, super elevation may be eliminated
 is the maximum super elevation rate in use. Drivers feel uncomfortable on sections with higher rates, and driver effort to maintain lateral position is high when speeds are reduced on such curves Where snow and ice are prevalent, a maximum value of 8% is generally used. Many agencies use this as an upper limit regardless, due to the effect of rain or mud on highways. Ice on the road can reduce friction force and vehicle travelling at less than the design speed on the excessively superelevated curve slide inward off the curve due to gravitational forces. In urban areas, where speeds may be reduced frequently due to congestion, maximum rates of 4%-6% are often used On low-speed urban streets or at intersections, super elevation may be eliminated.")
Similar presentations


 Highway Design Procedures/Route Geometric Design/Horizontal Alignment/Circular Curves Lecture.>")


>")

 Lec. 7& 8. Horizontal Alignment.>")
>")


