Download presentation
Presentation is loading. Please wait.

1
April, 2012 Strategy and Analyses Department Poland’s economy Poland’s economy & CEE region countries

2
22 Area: 323 thousand km 2 - 9th in Europe, 69th in the world Population: 38.5 million - 8th in Europe, 34th in the world Currency: Polish Zloty (EUR 1 ≈ PLN 4.12) (USD 1 ≈ PLN 2.96) GDP total: EUR 354.3 bln (USD 469.4 bln)* GDP per capita PPP: EUR 15 300 (USD 19 000)* GDP per capita: EUR 9 300 (USD 12 300)* GDP growth: 3.9%*; 4.3% - 2011 Membership: OECD, WTO, NATO, EU Large domestic market Central location in Europe International legal and business standards Young and well- educated workforce * Data for 2010 Strengths of Poland
 (USD 1 ≈ PLN 2.96) GDP total: EUR bln (USD bln)* GDP per capita PPP: EUR (USD )* GDP per capita: EUR (USD )* GDP growth: 3.9%*; 4.3% Membership: OECD, WTO, NATO, EU Large domestic market Central location in Europe International legal and business standards Young and well- educated workforce * Data for 2010 Strengths of Poland")
3
Prezentacja - Curabitur fermentum, leo eget auctor porta

4
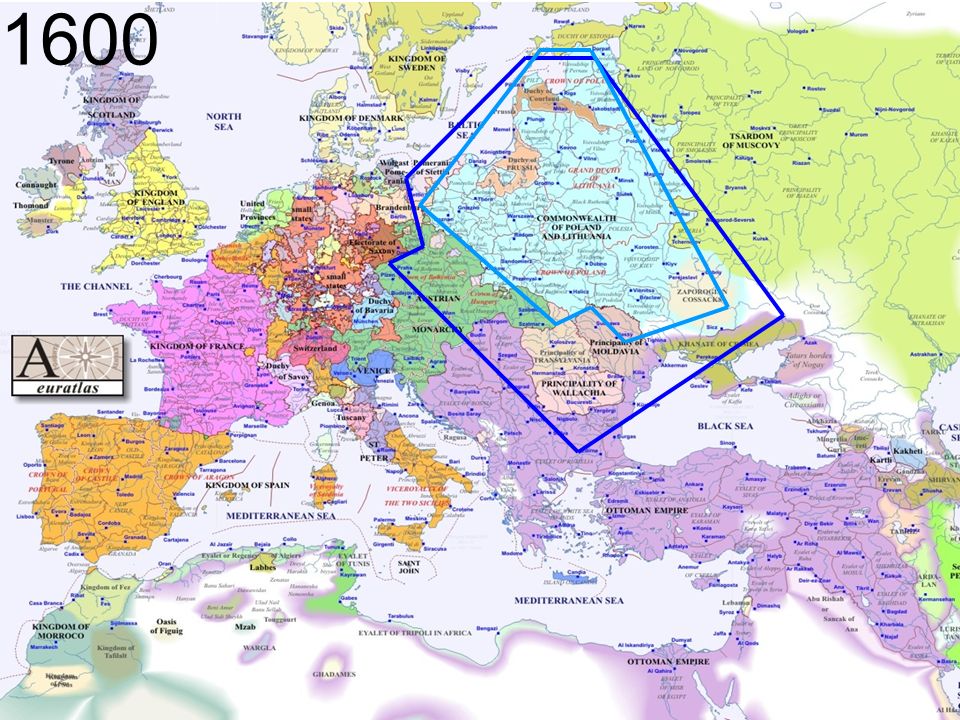
44 1600
5
1700

6
1800

7
1900

8
2000

9
99 Country Population in mln GDPTarde with China in USD mln* Nominal in USD mln% change Per capita PPP in USD thous. ExportsImportsBalance 2010 201120102011201020112010 Belarus 9,555,255,57,75,314,00015,028469,41 639,9-1 170,5 Bulgaria 7,547,753,50,41,712,96513,597296,2676,9-380,7 Croatia 4,460,863,8-1,20,017,81918,19237,71 440,7-1 403,0 Czech Republic 10,5197,7215,32,71,726,12127,0621 504,49 982,0-8 477,6 Estonia 1,318,322,22,37,618,53920,380175,7688,9-513,2 Hungary 10,0128,6140,31,31,718,81019,5911 920,66 176,9-4 256,3 Latvia 2,324,028,3-0,35,514,41915,66233,1286,3-253,2 Lithuania 3,336,542,71,45,917,33318,85636,9570,2-533,3 POLAND38,2469,4513,83,94,318,95120,3341 627,0**16 703,0**-15 076,0** Romania 21,5164,4189,8-1,62,511,90412,476410,13 381,5-2 971,4 Slovakia 5,487,296,14,23,522,12223,3041 358,03 922,0-2 564,0 Slovenia 2,047,049,61,4-0,228,13128,642116,41 394,7-1 278,2 Ukraine 45,8137,9165,04,15,26,6987,2331 316,64 700,4-3 383,8 TOTAL161,71 474,71 635,9XXXX9 302,251 563,4-42 261,2 Source: IMF & * UNCTAD ** The source of Polish trade data is Poland's CSO, as the only available data for Poland presented by UNCTAD is estimation CEE region macroeconomic data

10
HUAWEI CEE & Nordic Business Center Poland Czec h Romania Hungary HQ Area : 20000 m² Output : 3000 psc/month Supply Center: Hungary Area: Poland:200 m² Czech:180 m² Lectors : 30 Lessions : Radio , Transmission , Training Center : Poland & Czech Sweden 300+ specialists From 2000r. Radio Technology, Core network R&D Center in Sweden In 2008, Huawei established CEE & Nordic Business Center in Poland. 7*24 guarantee 500 engineers area: 1200m² Technical Supporting Center: Romania CEE & Nordic HQ: Poland Area: 5000 m² Employee : 500 Managing : 24 countries Including Sweden, Norway, Austria, Romania, Greece…

11
11 Entry into the NATO OECD WTO Schengen Poland joins the EU Leader of GDP growth in EU Poland’s GDP in mn PLN Data: Poland’s CSO Poland Sustainable and balanced economic growth * CSO preliminary estimation EU Presidency

12
12 % Data: Poland’s CSO Poland’s GDP growth (% change, yoy) According to preliminary estimates in 2011 GDP growth amounted to 4.3%. The biggest growth contribution was made by consumption.

13
13 Nominal GDP of CEE countries - EU member states (PPP, EUR bn, 2010) Data: Eurostat
 Data: Eurostat")
14
14 CEE countries GDP growth rates 2009-2011 (compared with the same period of the previous year) Data: Eurostat
 Data: Eurostat")
15
15 Data: Eurostat CEE countries industrial production January 2012 (yoy)
")
16
16 CEE countries construction production January 2012 (yoy) Data: Eurostat
 Data: Eurostat")
17
17 Data: Eurostat CEE countries inflation rate February 2012 (yoy)
")
18
18 Data: Eurostat CEE countries unemployment February 2012

19
Foreign trade in the years 2000-2011 19 Data: CSO

20
20 Foreign Direct Investments in Poland In 2010 FDI main foreign investors in Poland were European countries (EUR 6.6bn) At the end of 2010 FDI inward stock accounted to EUR 150.4bn. Companies from Germany, the Netherlands, and Luxembourg are the biggest foreign investors in Poland * Estimated value Foreign Direct Investments Data: NBP

21
Poland’s EU membership is beneficial for FDI Part of the single market of 455 million Stable economy Free movement of goods, services, capital and labuor Rise in production volume Increase in FDI inflow Increase in economic creditworthiness Transparent legal system Saving time from procedures while exporting and importing to the EU Easy transport within the EU, no delays at border crossing Financial aid from the EU 21

22
22 Data: European Commission 0 Projection of EU GDP growth in 2012 European Commission

23
23 Source: 2012 Budgetary Law Poland’s Economy – 2012 forecast IndicatorForecast GDP2.5% Domestic demand2.0% Consumption2.5% Private consumption2.9% Public consumption1.2% Gross capital formation0.1% Gross fixed capital formation1.5% Exports4.6% Imports3.2% Consumer Price Index2.8% Industry Price Index4.6% Unemployment rate12.3%

24
Pl. Trzech Krzyży 3/5 00-507 Warsaw tel +48 22 693 50 00 fax +48 22 693 40 46 email mg@mg.gov.pl web www.mg.gov.pl Ministry of Economy Thank you for your attention Ministry of Economypl. Trzech Krzyży 3/5tel. +48 22 693 50 00email: mg@mg.gov.pl Strategy and Analyses Department00-507 Warsawfax +48 22 693 40 46web: www.mg.gov.pl www.gochina.gov.pl/CEE more information on: www.mg.gov.pl >> Analizy>>English Version >> Poland's economic performance

Similar presentations
, 2004 EU-15 and other West European countries Hungary Czech Republic Malta Slovenia Cyprus Portugal Greece Spain.>")


 2.UNEMPLOYMENT 3.INFLATION 4.INCOME PER CAPITA 5.BALANCE OF PAYMENTS: EXPORTS.>")
>")


