Download presentation
Presentation is loading. Please wait.

1
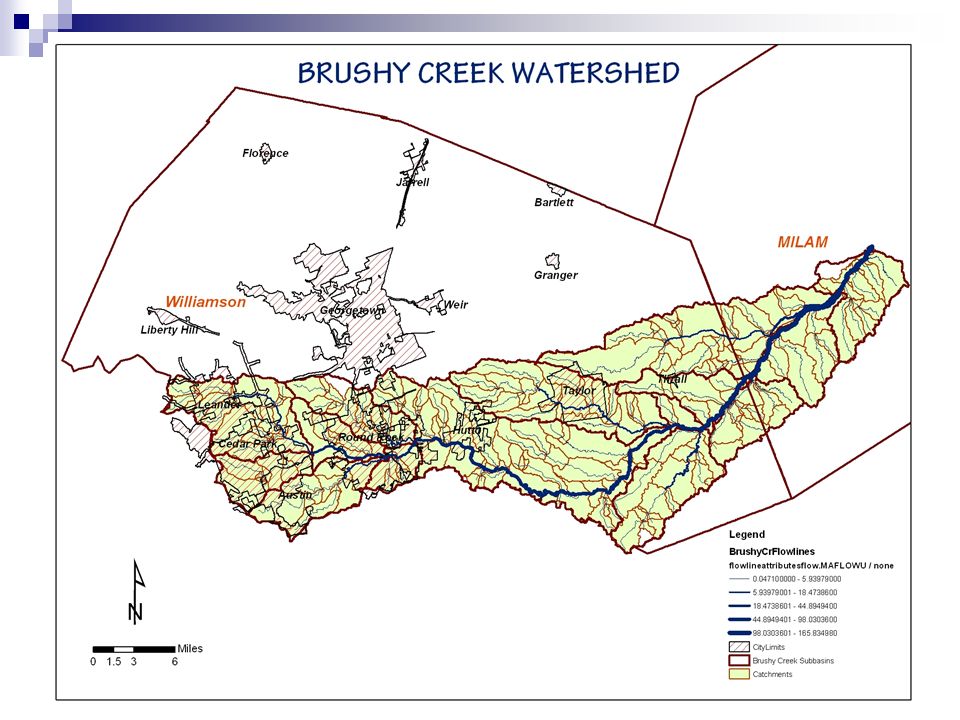
The Effects of Impervious Cover on a Hydrologic System BRUSHY CREEK WATERSHED By Ruth Haberman

2
OUTLINE: Introduction to Brushy Creek Watershed HEC-HMS Model Effects of Impervious Cover Conclusions Future Work

3
Williamso n County Brushy Creek Watershed Texa s Getting Oriented

4
Source: http://www.upperbrushycreekwcid.com/Dams/maps/ETJ.pdfhttp://www.upperbrushycreekwcid.com/Dams/maps/ETJ.pdf WILLIAMSON COUNTY 27th most rapidly growing county in the US between 2000 and 2005 30.4% Growth rate (U.S. Census Bureau) Round Rock 41.2% Cedar Park 84.8% Leander 135.0%
 Round Rock 41.2% Cedar Park 84.8% Leander 135.0%.")
7
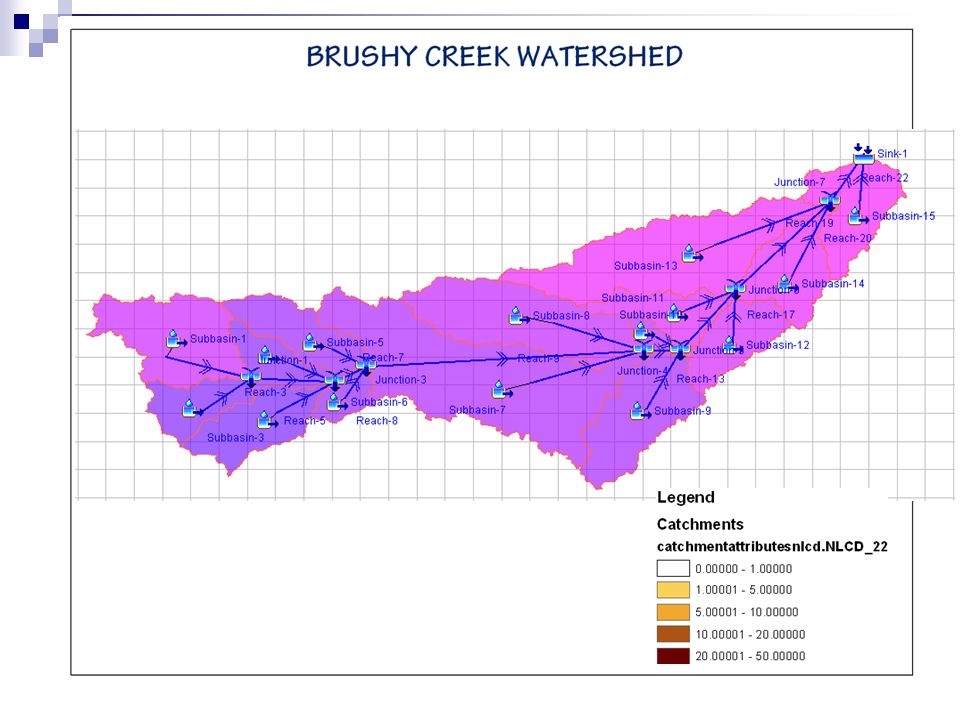
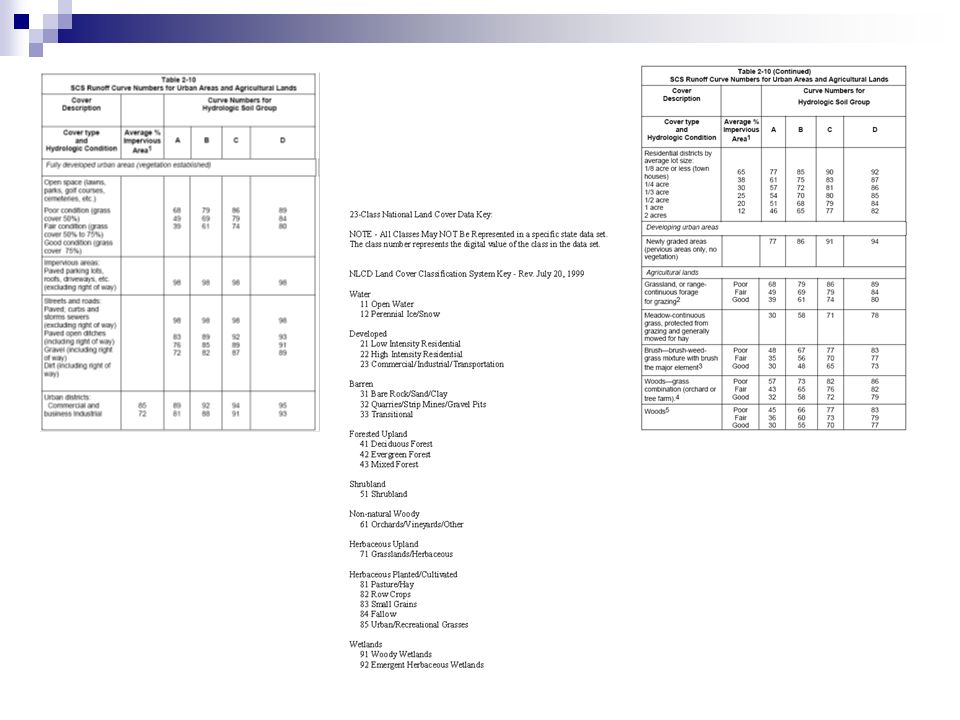
HEC-HMS Model Parameters : ArcHydro/NHDPlus Subbasin Areas and Centroids Longest Stream Paths Stream Slopes Developed Area (percent) Assumptions/Methods Synthetic Storm - SCS Type III Rainfall Distribution Snyder Unit Hydrograph Muskingum-Cunge Routing Method Type C Soils Calculations/Derivations Curve Numbers Impervious Area (percent) Lag Time Initial Abstraction (based on Curve Numbers)
 Assumptions/Methods Synthetic Storm - SCS Type III Rainfall Distribution Snyder Unit Hydrograph Muskingum-Cunge Routing Method Type C Soils Calculations/Derivations Curve Numbers Impervious Area (percent) Lag Time Initial Abstraction (based on Curve Numbers)")
8
Parameter Calculations: Areas to improve model – Calibration: Better terrain data - LIDAR More accurate slope calculations Actual impervious cover Include soil types in CN derivation Incorporate actual precipitation data

9
Effects of Impervious Cover Increased Impervious Cover in Subbasins 1 and 5 Existing Conditions Decreased Impervious Cover in Subbasins 2, 3. 4 and 6 Peak 8,500 CFS at 6:50 PM Peak 8,300 CFS at 6:55 PM Peak 8,800 CFS at 10:35 AM DECREASED IMPERVIOUS COVER OVER 13% OF AREA Existing Conditions INCREASED IMPERVIOUS COVER OVER 14% OF AREA Peak 8,500 CFS at 6:50 PM

10
Effects of Impervious Cover Increased Impervious Cover in Subbasins 1 and 5 Existing Conditions Decreased Impervious Cover in Subbasins 2, 3. 4 and 6 Peak 4,900 CFS at 5:30 AM Peak 3,250 CFS at 7:55 AM Peak 6,400 CFS at 4:35 AM DECREASED IMPERVIOUS COVER OVER 13% OF AREA INCREASED IMPERVIOUS COVER OVER 14% OF AREA

11
` New Subdivision Improvements New Educational Facility New Development

12
Impervious cover affects runoff Quantity Timing Hydrologic models can help predict the effect of a development site Model should cover an entire watershed Conclusions:

13
Future Work: Refine and calibrate model Develop hydraulic model – HEC-RAS Model water quality

14
QUESTIONS?

Similar presentations