Download presentation
Presentation is loading. Please wait.

1
WQX and FIFRA Data Larry Theller, ABE, Purdue University Leighanne Hahn, OISC November 10, 2011

2
WQX and FIFRA Data What is WQX How is it used Original concept for data upload Current “state of the art” data loader Process flow Dataloader upgrades created for this project Future Tools (2 year NEIEN project)
")
3
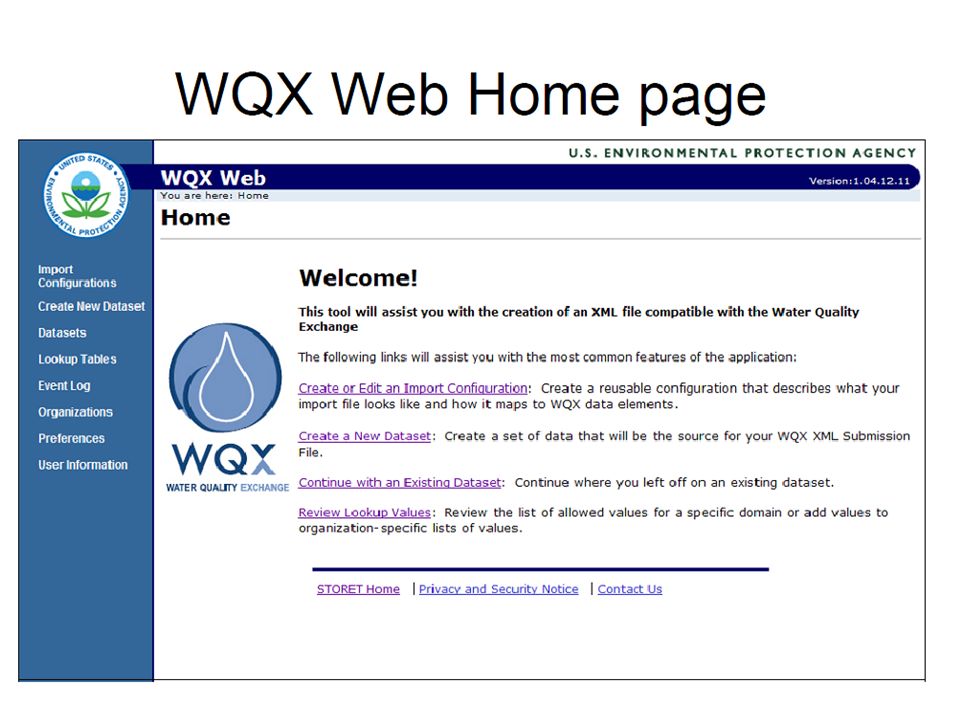
WQX as Framework The Water Quality Exchange (WQX) is a new framework that makes it easier for States, Tribes, and others to submit and share water quality monitoring data over the Internet. States, Tribes and other organizations can now submit data directly to the publicly-accessible STORET Data Warehouse using the WQX framework. WQX will eventually replace the distributed STORET, the STORET Data Entry Module, Reports Module, and STORET Import Module or SIM as the primary means of submitting water quality monitoring data to EPA.

4
Win 2003 Server Purdue-OISC EN WQX Node Network Design Red Hat Entp MySQL ECN 8-Core Red Hat Server Ubuntu MySQL Oracle Web XML Traffic Development (Test) computer Main Development Server Interim Production Server Permanent Production Server abeip867 abe2k3s2 Templeton.ecn laptops Data Loader Test Query Test Backup of Prod. database

6
http://www.epa.gov/storet/wqx/products/WQX_factsheet.pdf

7
Text-based Query

8
WQX data in Action

9
Map Display of location, with query

10
10

11
Load and Flow Duration Curves

12
12

16
http://www.epa.gov/storet/wqx/products/WQX_factsheet.pdf Project Name Monitoring Locations 2011 Activity - Results 2010Activity - Results 2009 Activity - Results

19
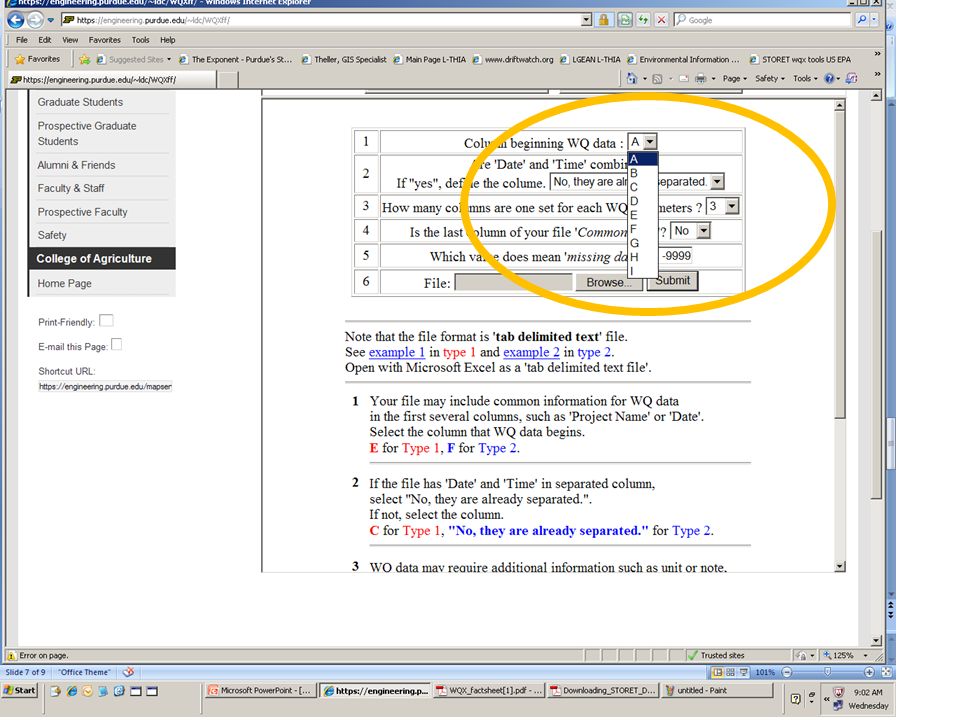
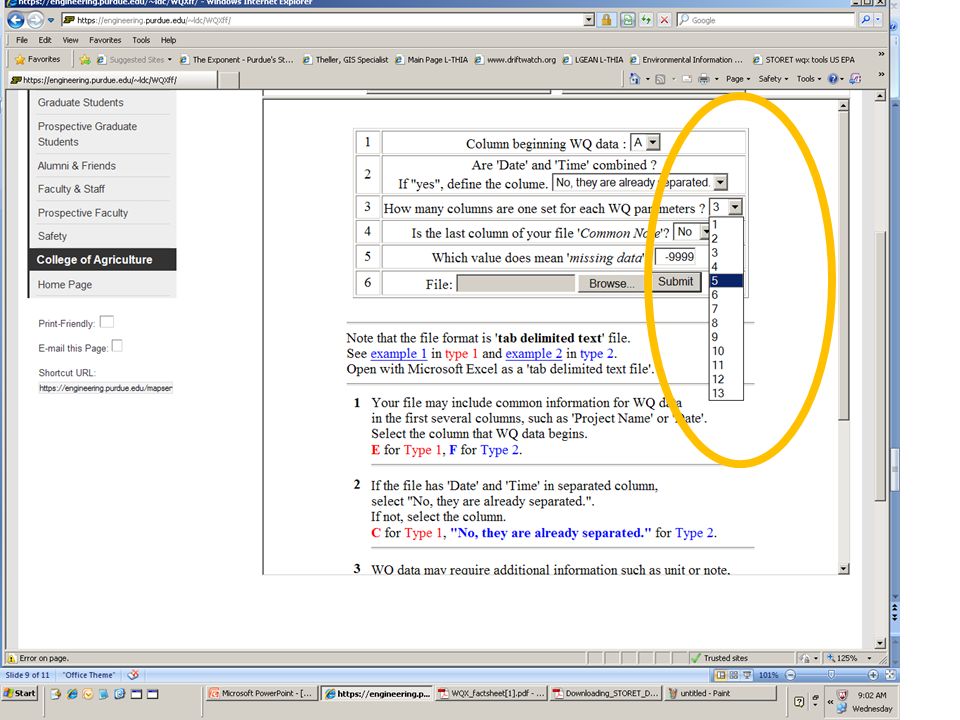
In this typical spreadsheet layout, the measurements are in columns, and each set of samples from a location is a row.

20
The columns need to pivot so each measurement become rows, and the data collection notes need to be replicated.

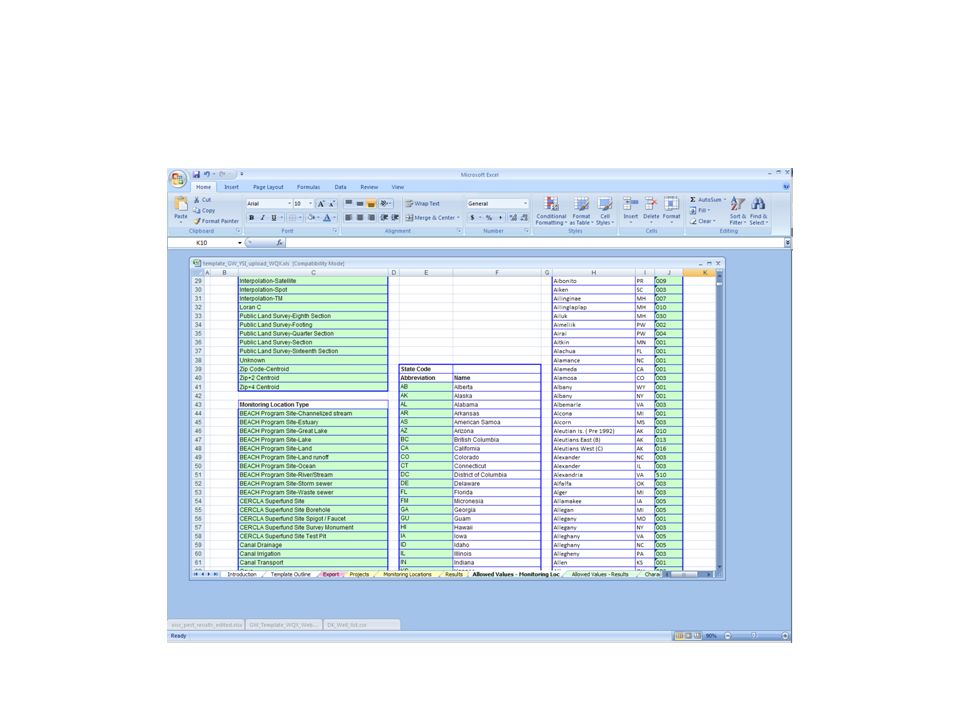
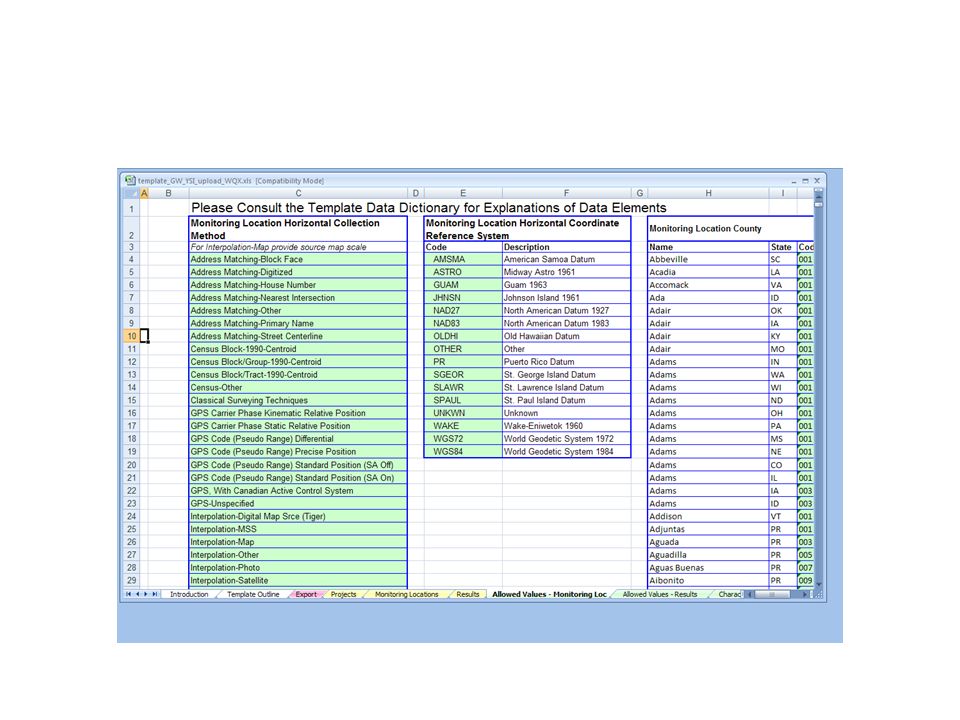
21
The pink colored tab is used to export data for upload; The yellow tabs to set-up the input data; The green tabs provide a linked reference for documented elements in WQX.

22
STORET Web Service in ArcGIS 10 Easy to identify locations; Experienced GIS user can run queries

Similar presentations


 for biological data analysis and data upload to STORET>")


 739-3490>")

