Download presentation
Presentation is loading. Please wait.

1
WQX Web and FIFRA Data Larry Theller, ABE, Purdue University Leighanne Hahn, OISC March 22, 2012

2
WQX and FIFRA Data What is WQX How is it used Original concept for data upload Current “state of the art” data loader Process flow Data loader upgrades created for this project Future Tool (2 year NEIEN project)
")
3
WQX as Framework The Water Quality Exchange (WQX) is a framework that makes it easier for States, Tribes, and others to submit and share water quality monitoring data over the Internet. States, Tribes and other organizations can now submit data directly to the publicly-accessible STORET Data Warehouse using the WQX framework. WQX will eventually replace the distributed STORET, the STORET Data Entry Module, Reports Module, and STORET Import Module or SIM as the primary means of submitting water quality monitoring data to EPA.

4
http://www.epa.gov/storet/wqx/products/WQX_factsheet.pdf CDX STORET NODE WEB

5
Win 2003 Server Purdue-OISC WQX NODE Network Design Red Hat Entp MySQL ECN 8-Core Red Hat Server Ubuntu MySQL Oracle Authenticated QUERY to CDX Development (Test) computer Main Development Server Interim Production Server Rollover to: Permanent Production Server abeip867 abe2k3s2 Templeton.ecn laptops Data Loader Test Query Test Backup of Prod. database Proposed, Tested, but Not Implemented

6
Current WQX Web Design Staging CDX Authenticated upload to staging database Interim Production Server Spreadsheet of results Excel QC done and Reformat to XML OISC Authenticated XML upload to CDX 1 2

7
WQX_Web_User_Guide_v2.0.pdf

10
http://www.epa.gov/storet/wqx/products/WQX_factsheet.pdf Project Name Monitoring Locations 2011 Activity - Results 2010Activity - Results 2009 Activity - Results

11
Sample XML for monitoring location upload.

12
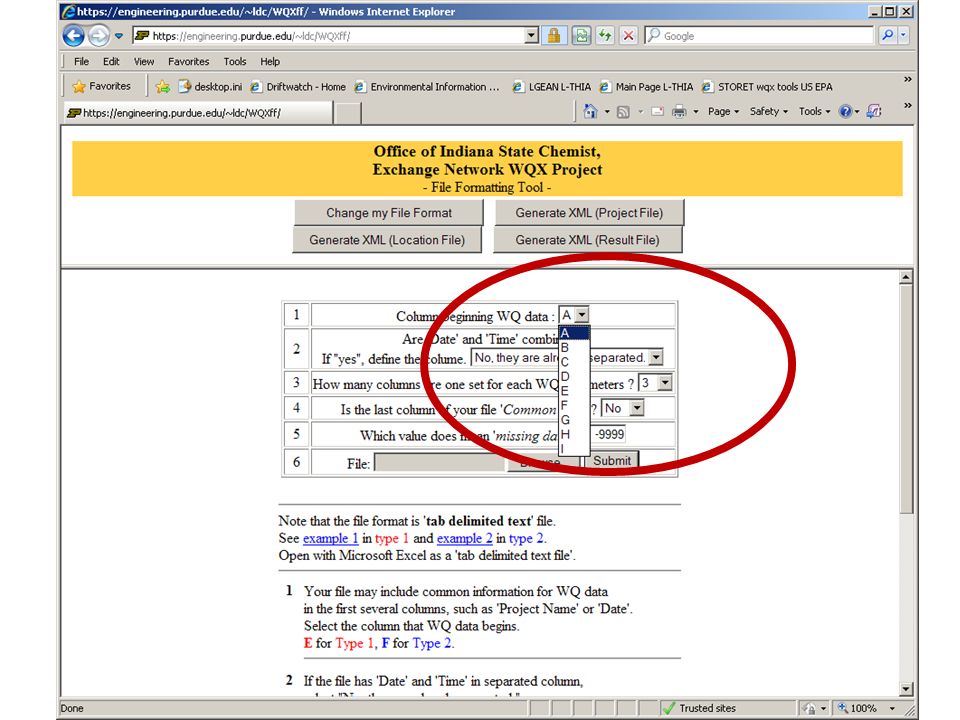
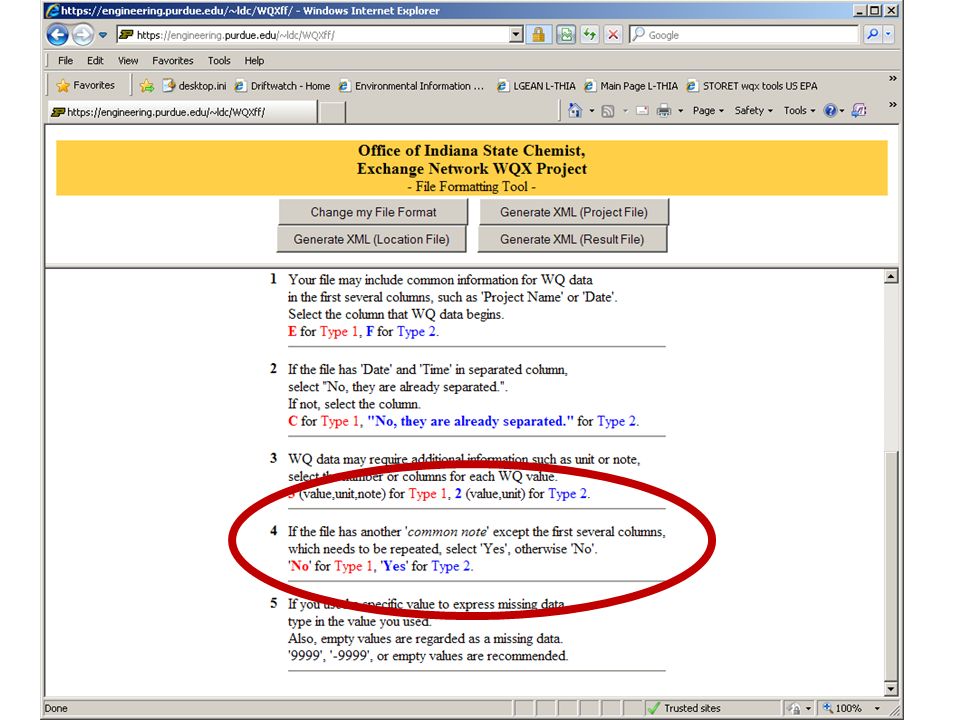
In this typical spreadsheet layout, the measurements are in columns, and each set of samples from a location is a row.

13
The columns need to pivot so each measurement becomes one row, and the data collection notes need to be replicated for each measurement.

15
The pink colored tab is used to export data for upload; The yellow tabs to set-up the input data; The green tabs provide a linked reference for documented elements in WQX.

21
New Tool under development Load and Flow Duration Curve (LDC) – Upload of flow data from USGS – Upload of water quality data from USGS – Upload of water quality data from WQX Current Grant: WQX data in Action
 – Upload of flow data from USGS – Upload of water quality data from USGS – Upload of water quality data from WQX Current Grant: WQX data in Action")
23
23

24
Load and Flow Duration Curves

26
The End

Similar presentations


 739-3490>")


