Download presentation
Presentation is loading. Please wait.

1
LOCAL ENSEMBLE KALMAN FILTER (LETKF) ANALYSIS OF LOOP CURRENT & EDDY IN THE GULF OF MEXICO Fanghua Xu 1, Leo Oey 1, Yasumasa Miyazawa 2, Peter Hamilton 3 IWMO, 2012 1: Princeton University 2: JAMSTEC 3: SAIC
 ANALYSIS OF LOOP CURRENT & EDDY IN THE GULF OF MEXICO Fanghua Xu 1, Leo Oey 1, Yasumasa Miyazawa 2, Peter Hamilton 3 IWMO, : Princeton University 2: JAMSTEC 3: SAIC")
2
mpiPOM-LETKF gues/restart.ncLETKF anal/restart.nc mean/ sprd/ ensfcst(mpiPOM) obs SSHA SST T&S U&V +2d Observation increments/innovations
 obs SSHA SST T&S U&V +2d Observation increments/innovations")
3
LETKF runnumobs data used 012SSHA (>500m)+MCSST+parm_infl (42%) 013SSHA (>500m)+MCSST+parm_infl (10.5%) 014SSHA(>500m) +MCSST+LC(uv, err = 0.05 m/s) 015SSHA(>500m)+MCSST +parm_infl (21%) 016SSHA(>500m) +MCSST+LC(uv, err = 0.1 m/s) OISSHA(>500m)+MCSST 90-day Experiments (2010/04/22 – 2010/07/21) LETKF parameters Horizontal localization scale7 (number of grids,1/3 degree) vertical localization scale (m)2000 Covariance inflation parameter (%)21 (10.5, 42) Observation error of SSHA (m)0.2 (0.1 & 0.05) Observation error of T ( 0 C)1.0 ( ) Time interval of LETKF (day)2 ensemble members20
+MCSST+parm_infl (42%) 013SSHA (>500m)+MCSST+parm_infl (10.5%) 014SSHA(>500m) +MCSST+LC(uv, err = 0.05 m/s) 015SSHA(>500m)+MCSST +parm_infl (21%) 016SSHA(>500m) +MCSST+LC(uv, err = 0.1 m/s) OISSHA(>500m)+MCSST 90-day Experiments (2010/04/22 – 2010/07/21) LETKF parameters Horizontal localization scale7 (number of grids,1/3 degree) vertical localization scale (m)2000 Covariance inflation parameter (%)21 (10.5, 42) Observation error of SSHA (m)0.2 (0.1 & 0.05) Observation error of T ( 0 C)1.0 ( ) Time interval of LETKF (day)2 ensemble members20")
4
LETKF015 Positions of the observation data assimilated in GOM, red: satellite SST; blue: AVISO SSHA Mooring locations near the Loop currents, red: measurements from ~80m to ~3000m Blue: measurements in deep (about 3000m) Loop Currents mooring locations
 Loop Currents mooring locations")
5
Model results are compared with 1. Satellite Sea Surface height (SSH); AVISO NRT map data (http://www.aviso.oceanobs.com/)http://www.aviso.oceanobs.com/ 2. Loop Currents mooring data; (Dr. Peter Hamilton) 3. ADCP data. (http://www.ndbc.noaa.gov/maps/ADCP_WestGulf.shtml)http://www.ndbc.noaa.gov/maps/ADCP_WestGulf.shtml
; AVISO NRT map data ( 2. Loop Currents mooring data; (Dr. Peter Hamilton) 3. ADCP data. (")
6
Comparison between model and AVISO SSH Color: model SSH; white line: AVISO SSH=0 line OI LETKF015

7
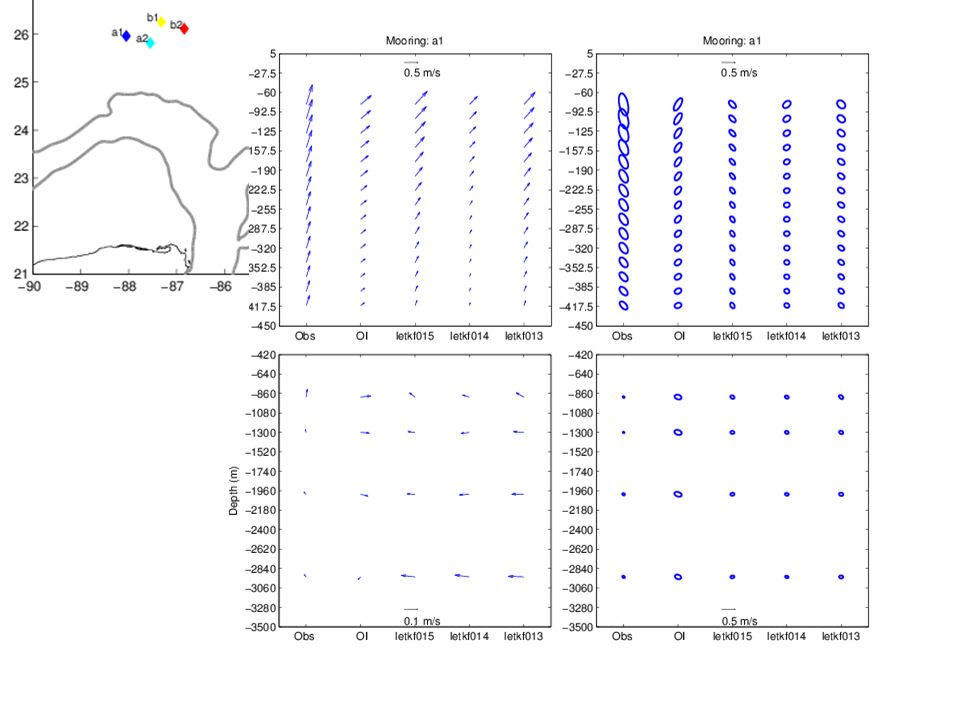
OI for the first 30 days OI for the entire 90 days 015 for the first 30 days 015 for the entire 90 days Blue: mooring; red: model -100m

8
OI for the first 30 days015 for the first 30 days -500m OI for the entire 90 days015 for the entire 90 days Blue: mooring; red: model

9
run V. Corrskillmean Std R. Rθuv spd ratio αm-αoαm-αo OI0.4130 o 0.730.770.58-44 o 0.99 0150.4130 o 0.94 0.95-23 o 0.70 0140.3030 o 0.900.830.68-40 o 0.83 0130.3452 o 0.93 0.96-23 o 0.82 0120.3438 o 0.930.940.95-16 o 0.76 0160.3525 o 0.950.810.71-28 o 0.75 90 days Vector Corr Coef (R) & Angles averaged over 4 moorings as a function of depth
 & Angles averaged over 4 moorings as a function of depth.")
11
runRθ skillmean std ratio uv m-o OI0.5153 o 0.360.700.85-14 o 0.94 0150.5992 o 0.310.750.79-2 o 0.69 0140.5362 o 0.310.700.74-16 o 0.67 0130.6672 o 0.290.760.96-12 o 0.98 0120.6872 o 0.270.690.87-6 o 0.92 Comparison between model & d moorings (54 days) Vector Corr Coef (R) & Angles ( θ ) at d moorings
 Vector Corr Coef (R) & Angles ( θ ) at d moorings")
12
OI 015 Blue: mooring; red: model 014013 Comparison of model and mooring D over 54 days

13
LETKF comparison with 3 ADCPs 20100501~20100721 OI012

14
Summary The LETKF data assimilation results are in good agreement with the observation data, including satellite SSH, ADCPs, and moorings. LETKF data assimilation improves model simulation significantly, compared with the traditional OI assimilation results; The Loop current and its eddies are well represented, especially in mid water depth.

16
Principles X b : background field Y o : observed variable H : the observation operator that performs the necessary interpolation and transformation from model variables to observation space H(X b ): background or first guess of observations W: weights determined by the estimated statistical error covariance of the forecast and the observations. X a : analysis Observation increments/innovations SCM, OI, 3D-Var, and KF…

17
OI 015 014 013

21
Corr. & RMS error of model with satellite SSHA (h>500m) in GOM
 in GOM")
22
runRθskillmeanstd ratio uv m-o OI 0.41-0.1 o 0.260.691.4-110 o 0.26 012 0.66-16 o 0.050.572.7-214 o 0.40 013 0.58-33 o 0.040.533.8-88 o 0.38 014 0.56-23 o 0.040.563.3-208 o 0.36 015 0.4715 o 00.612.9-1820.28 runRθskillmeanstd ratio uv m-o OI 0.36-14 o 00.481.7-129 o 0.41 012 0.50-20 o 0.930.650.70-7 o 0.82 013 0.42-16 o 0.600.240.42-5 o 0.73 014 0.47-12 o 0.750.420.585o5o 0.81 015 0.44-6 o 0.730.620.50-7 o 0.71 500m 100m Model comparison with ADCP in the northern Gulf

23
LETKF$runnumstatusobs data used 001C(90 days)SSHA only (msla) 002C (30days)SSHA+MCSST 003C(90 days)SSHA+T(ship) 004C(90 days)SSHA+TS(ship) 005C(90days)SSHA(>500m)+MCSST 006C(90 days)SSHA trackdata(>500m) 007C(90 days)SSHA trackdata(>500m)+MCSST 008C(90 days)SSHA trackdata(>500m)+MCSST+TS(ship) 009C(90days)SSHA (msla, >500m)+MCSST+TS(ship) 012C(90 days)SSHA (>500m)+MCSST+parm_infl (42%)
SSHA only (msla) 002C (30days)SSHA+MCSST 003C(90 days)SSHA+T(ship) 004C(90 days)SSHA+TS(ship) 005C(90days)SSHA(>500m)+MCSST 006C(90 days)SSHA trackdata(>500m) 007C(90 days)SSHA trackdata(>500m)+MCSST 008C(90 days)SSHA trackdata(>500m)+MCSST+TS(ship) 009C(90days)SSHA (msla, >500m)+MCSST+TS(ship) 012C(90 days)SSHA (>500m)+MCSST+parm_infl (42%)")
Similar presentations


 University.>")

 File: AMSEAS_GOM_NCOM_Evals_all_16FEB11.ppt June coverage –>")


 # F.-H. Xu & L.-Y. Oey* Princeton University *>")


>")


-3DVAR and ensemble square root filter (EnSRF) analysis schemes Xuguang Wang NOAA/ESRL/PSD,>")
 & length w/wave- breaking and Stokes drift TKE production; wave- enhanced.>")

