Download presentation
Presentation is loading. Please wait.

2
CORTICAL SELF-ORGANIZATION AND PERCEPTUAL LEARNING Mike Kilgard University of Texas at Dallas

3
Pioneering experiments by Hubel and Wiesel, Merzenich, Weinberger, Greenough, and many others have shown that cortical circuits are highly adaptive. Neural plasticity is likely involved in perceptual learning, development, and recovery from brain injury. Cochlea Cortex Tone Frequency Action Potentials

4
Time Frequency 15 Word Speech Stream >10 45 possibilities

5
Techniques used to study how complex sounds alter cortical processing Environmental Nucleus Basalis Behavioral Enrichment Stimulation Training

7
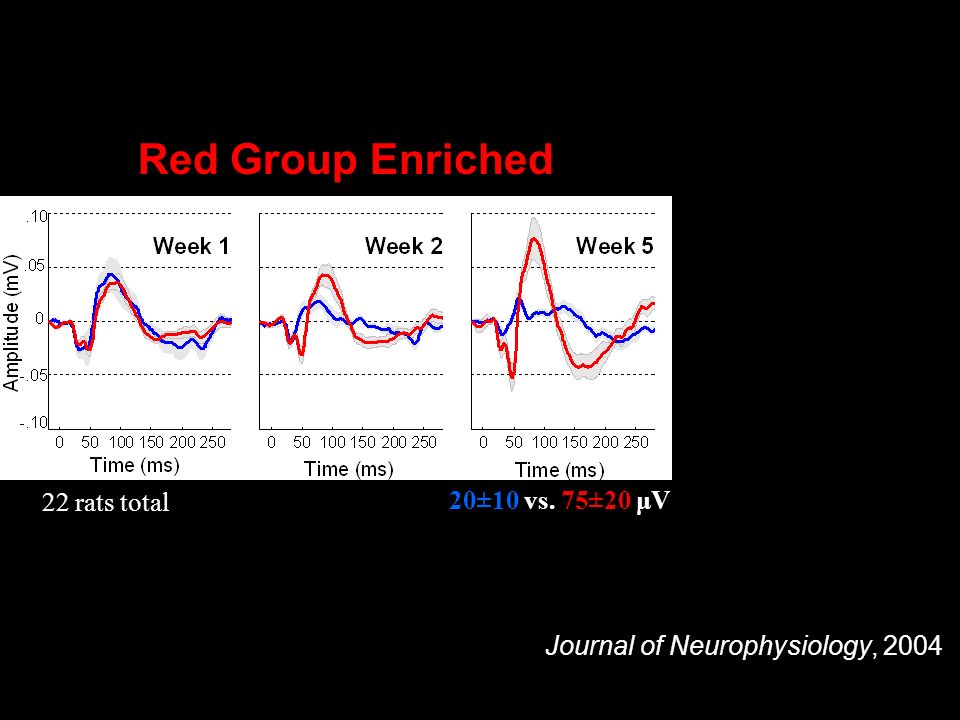
20±10 vs. 75±20 μV 81±19 vs. 37±20 μV Red Group EnrichedBlue Enriched 22 rats total Journal of Neurophysiology, 2004

8
High-density Microelectrode Mapping

9
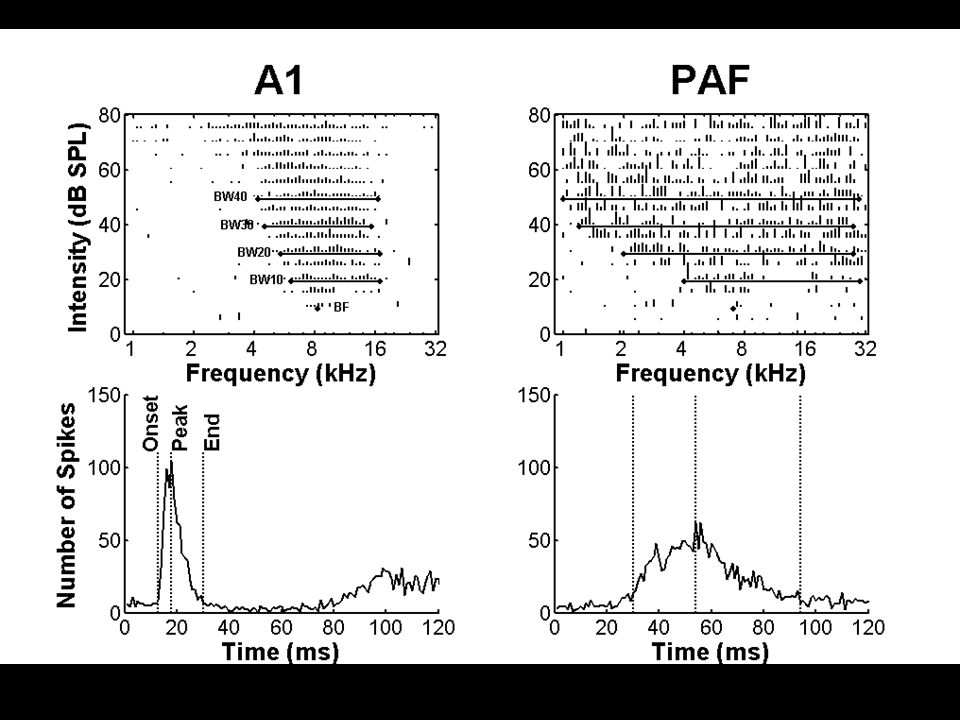
40% increase in response strength –1.4 vs. 1.0 spikes per noise burst (p< 0.00001) 10% decrease in frequency bandwidth –2.0 vs. 2.2 octaves at 40dB above threshold (p< 0.05) 3 dB decrease in threshold –17.2 vs. 20 dB (p< 0.001) Decrease in best rate by 1.1 Hz in enriched rats –7.8 vs. 6.7 Hz (p< 0.001) Enrichment effects persist under general anesthesia n = 16 rats, 820 A1 sites Journal of Neurophysiology, 2004
 10% decrease in frequency bandwidth –2.0 vs. 2.2 octaves at 40dB above threshold (p< 0.05) 3 dB decrease in threshold –17.2 vs. 20 dB (p< 0.001) Decrease in best rate by 1.1 Hz in enriched rats –7.8 vs. 6.7 Hz (p< 0.001) Enrichment effects persist under general anesthesia n = 16 rats, 820 A1 sites Journal of Neurophysiology,")
10
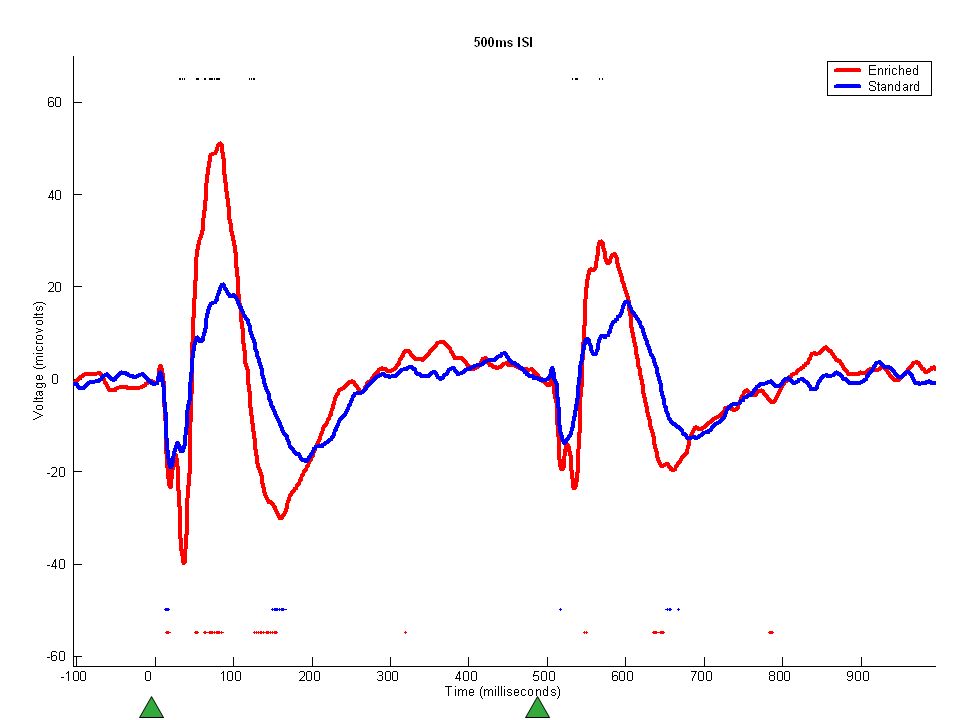
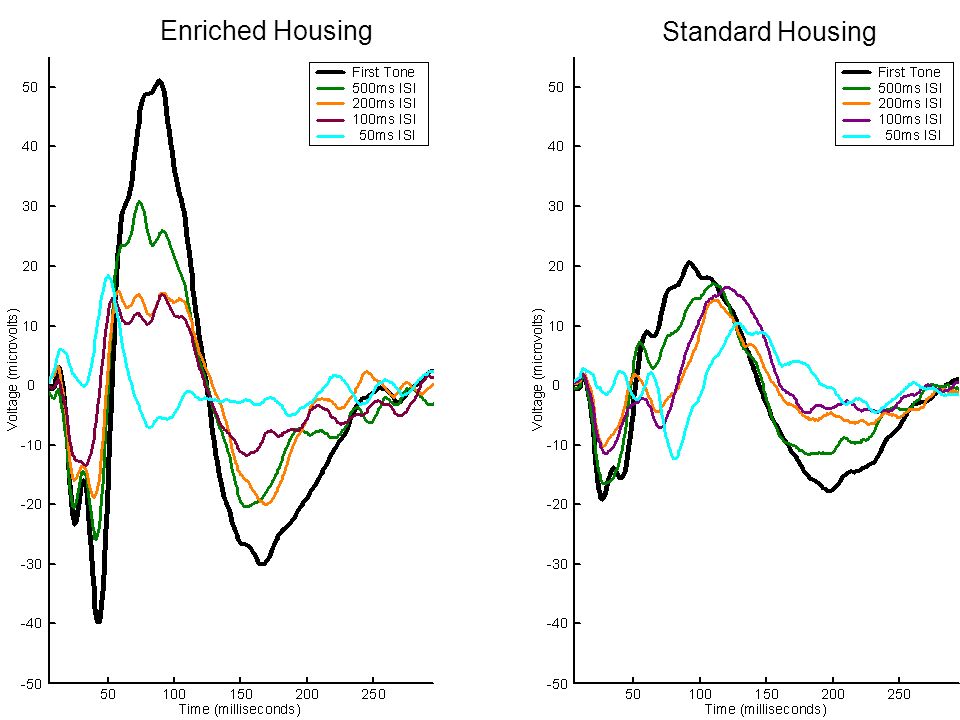
Enriched housing alters temporal processing

11
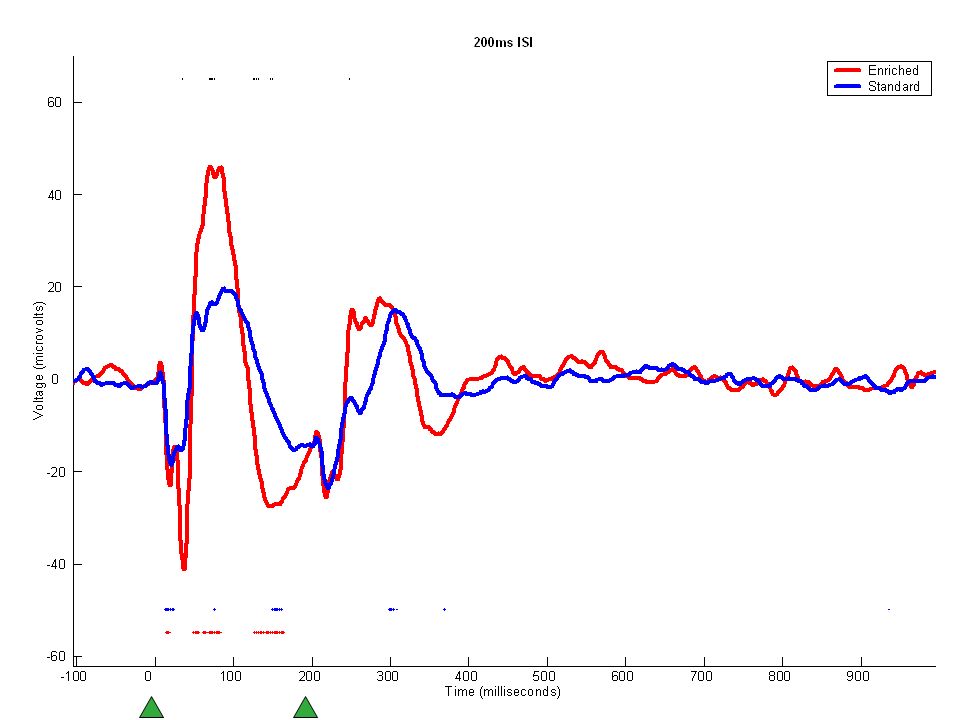
200 ms Interstimulus Interval Enrichment Increases Paired Pulse Depression

13
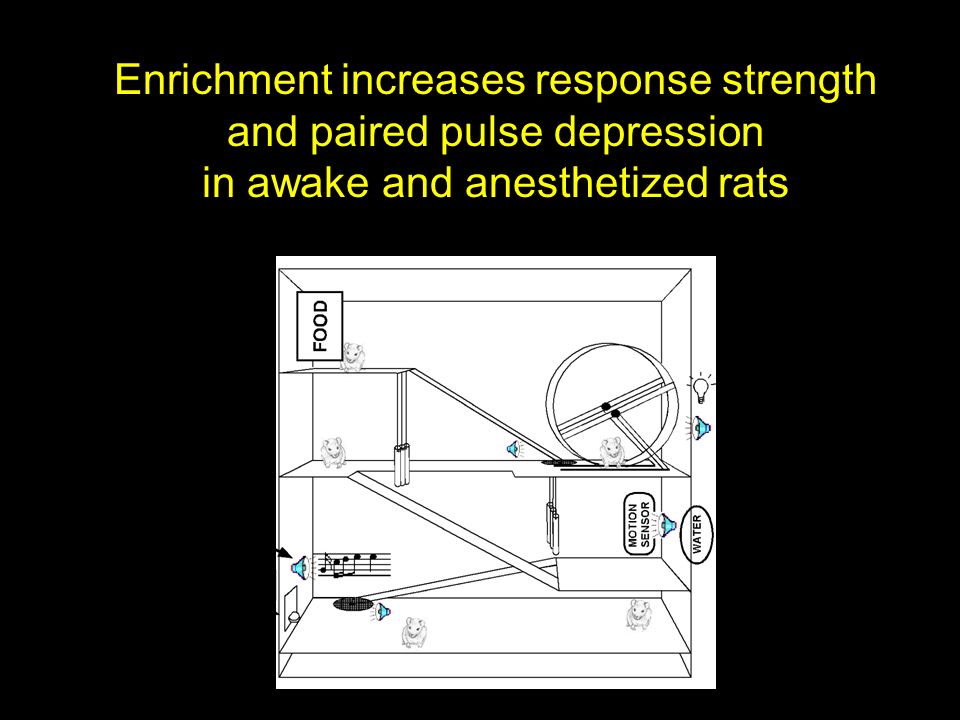
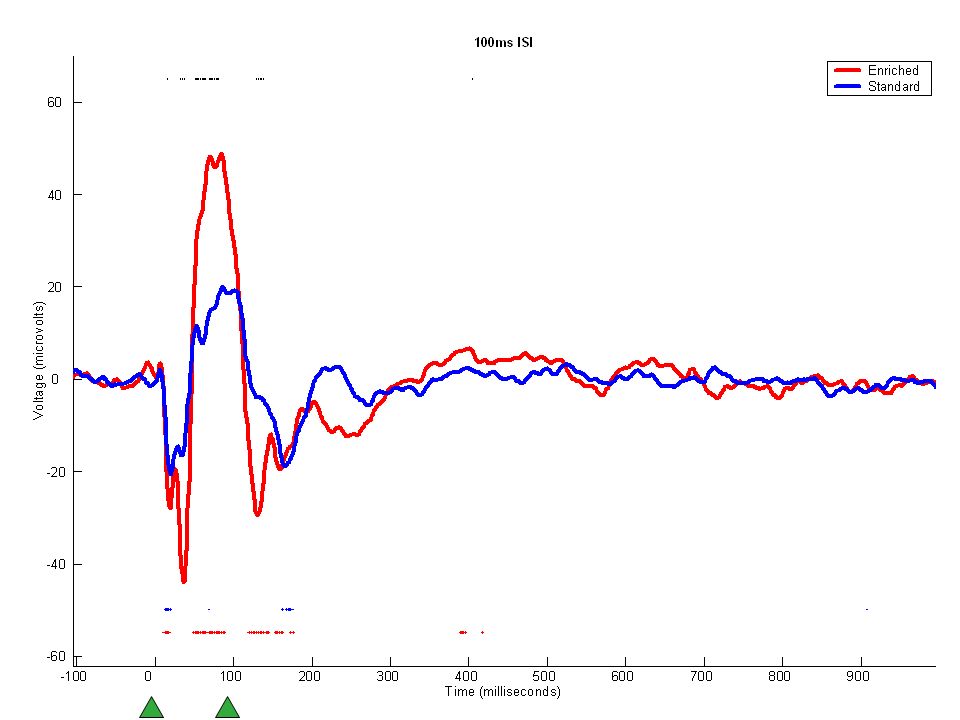
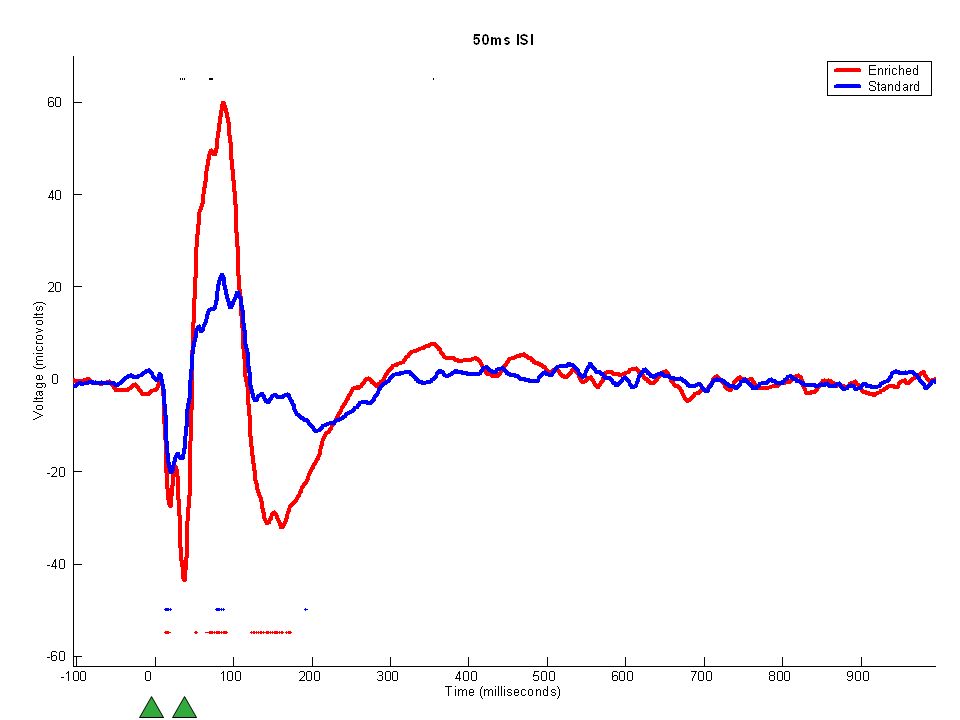
Enrichment increases response strength and paired pulse depression in awake and anesthetized rats

14
Nucleus basalis stimulation causes stimulus specific plasticity. NB stimulation paired with a sound 300 times per day for 25 days. Pairing occurred in awake unrestrained adult rats. Stimulation efficacy monitored with EEG. Stimulation evoked no behavioral response.

15
Nucleus basalis stimulation paired with sensory experience can alter: Cortical Topography Maximum Following Rate Receptive Field Size Response Strength Synchronization Spectrotemporal Selectivity

16
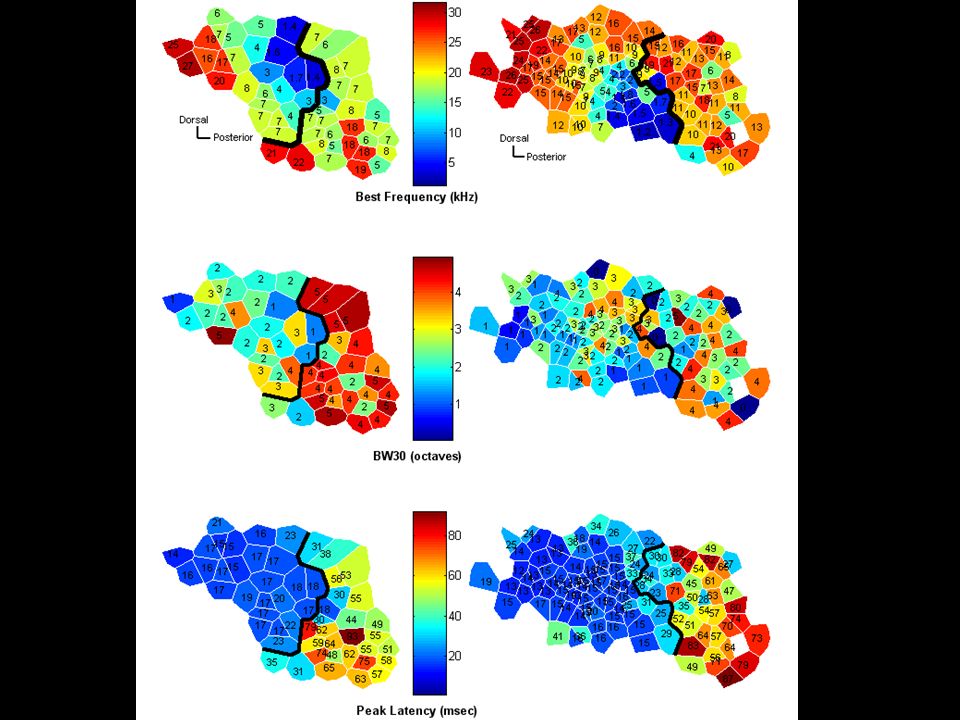
Best Frequency Science, 1998 NB

17
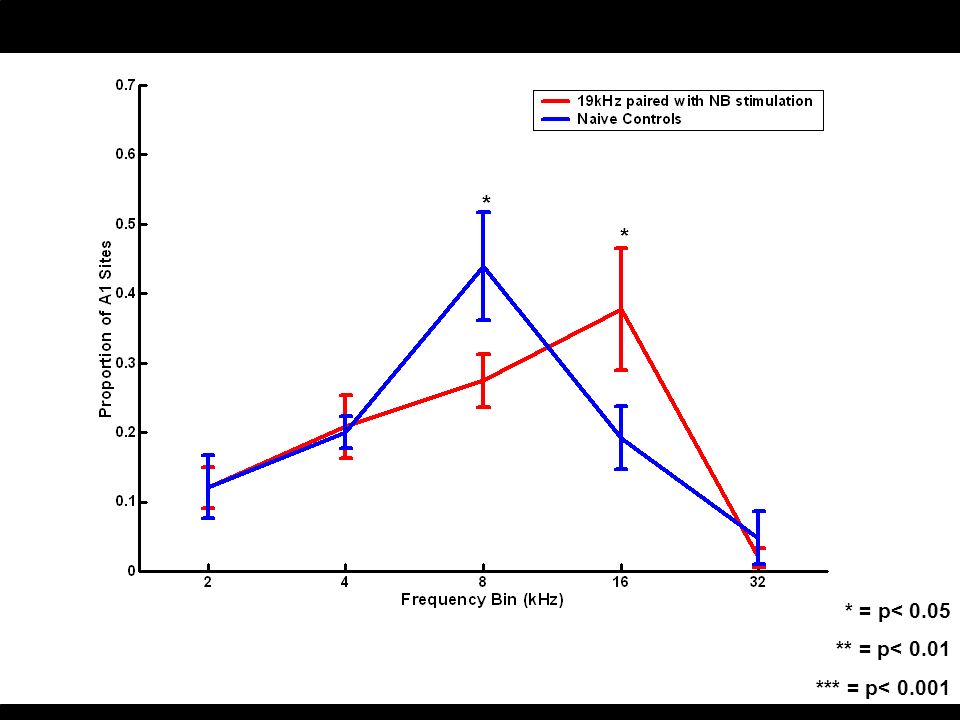
Tone Frequency - kHz Frequency-Specific Map Plasticity N = 20 rats; 1,060 A1 sites

18
Naïve Control 1 Day Post 10 Day Post 20 Day Post All Groups 40 30 20 10 0 Percent of Cortex Responding to 21 kHz at 40 dB * = p< 0.05 ** = p< 0.01 * * * ** Tone Frequency (kHz)
")
19
Reduced response to low frequency tones, p <0.001 Decreased bandwidth of high frequency neurons –2.8 vs. 3.8 octaves, p<0.0001 (30 dB above threshold) Plasticity in Posterior Auditory Field N = 12 rats; 396 PAF sites
 Plasticity in Posterior Auditory Field N = 12 rats; 396 PAF sites.")
20
How does experience alter temporal processing?

21
Response of Neurons at a Single Site to Repeated Tones Group Average

22
Nature Neuroscience, 1998 N = 15 rats, 720 sites

23
Journal of Neurophysiology, 2001 N = 13 rats, 687 sites Temporal Plasticity is Influenced by Carrier Frequency

24
Stimulus Paired with NB Activation Determines Degree and Direction of Receptive Field Plasticity Frequency Bandwidth Plasticity N = 52 rats; 2,616 sites

25
Frequency Bandwidth is Shaped by Spatial and Temporal Stimulus Features Modulation Rate (pps) 0 5 10 15 Tone Probability 15% 50 % 100% Journal of Neurophysiology, 2001 Spatial Variability Leads to Smaller RF’s Temporal Modulation Leads to Larger RF’s
 Tone Probability 15% 50 % 100% Journal of Neurophysiology, 2001 Spatial Variability Leads to Smaller RF’s Temporal Modulation Leads to Larger RF’s")
26
How do cortical networks learn to represent more complex sounds? FM sweeps 32 16 8 4 2 1 Frequency 160ms Experimental Brain Research, 2004

27
32 16 8 4 2 1 Frequency Time NB Stim. FM Sweep paired with NB stimulation (8 to 4 kHz in 160 ms) No map expansion No preference for downward vs. upward FM sweeps Decreased threshold by 3 dB and latency by 2 ms, and increased RF size by 0.2 octaves only in the region of the frequency map activated by sweep (p<0.01)
 No map expansion No preference for downward vs. upward FM sweeps Decreased threshold by 3 dB and latency by 2 ms, and increased RF size by 0.2 octaves only in the region of the frequency map activated by sweep (p<0.01).")
28
32 16 8 4 2 1 Frequency Time NB Stim. FM Sweeps paired with NB stimulation Five downward sweeps of one octave in 160 ms No significant plasticity

29
32 16 8 4 2 1 Frequency Time NB Stim. Does acoustic context influence plasticity? Five downward sweeps of one octave in 160 ms plus unpaired upward (160 ms) and downward (40 or 640 ms) sweeps Decreased threshold by 5 dB and latency by 2 ms, and increased RF size by 0.2 octaves all across map (p<0.01) No preference for downward vs. upward FM sweeps
 and downward (40 or 640 ms) sweeps Decreased threshold by 5 dB and latency by 2 ms, and increased RF size by 0.2 octaves all across map (p<0.01) No preference for downward vs. upward FM sweeps.")
30
Spectrotemporal Sequence 100ms20ms High Tone (12 kHz) Low Tone (5 kHz) Noise Burst Time Frequency
 Low Tone (5 kHz) Noise Burst Time Frequency ")
31
Paired w/ NB stimulation 100ms20ms High Tone (12 kHz) Low Tone (5 kHz) Noise Burst Unpaired background sounds }
 Low Tone (5 kHz) Noise Burst Unpaired background sounds }")
32
Context-Dependent Facilitation 100ms20ms High Tone (12 kHz) Low Tone (5 kHz) Noise Burst Number of Spikes 0 100 200 300 400ms +50%
 Low Tone (5 kHz) Noise Burst Number of Spikes ms +50%")
33
58% of sites respond with more spikes to the noise when preceded by the high and low tones, compared to 35% in naïve animals. (p< 0.01) Context-Dependent Facilitation 100ms20ms Low Tone (5 kHz) Noise Burst High Tone (12 kHz) N = 13 rats, 261 sites Proceedings of the National Academy of Sciences, 2002
 Context-Dependent Facilitation 100ms20ms Low Tone (5 kHz) Noise Burst High Tone (12 kHz) N = 13 rats, 261 sites Proceedings of the National Academy of Sciences,")
34
25% of sites respond with more spikes to the low tone when preceded by the high tone, compared to 5% of sites in naïve animals. (p< 0.005) Context-Dependent Facilitation Low Tone (5 kHz) 100ms20ms High Tone (12 kHz) Low Tone (5 kHz) Noise Burst N = 13 rats, 261 sites Proceedings of the National Academy of Sciences, 2002
 Context-Dependent Facilitation Low Tone (5 kHz) 100ms20ms High Tone (12 kHz) Low Tone (5 kHz) Noise Burst N = 13 rats, 261 sites Proceedings of the National Academy of Sciences,")
35
10% of sites respond with more spikes to the high tone when preceded by the low tone, compared to 13% of sites in naïve animals. Context-Dependent Facilitation 100ms20ms Noise Burst High Tone (12 kHz) High Tone (12 kHz) N = 13 rats, 261 sites Proceedings of the National Academy of Sciences, 2002 Low Tone (5 kHz)
 High Tone (12 kHz) N = 13 rats, 261 sites Proceedings of the National Academy of Sciences, 2002 Low Tone (5 kHz).")
36
Time Frequency How do cortical networks learn to represent speech sounds?

37
Sash

38
‘SASH’ Group - Spectrotemporal discharge patterns of A1 neurons to ‘sash’ vocalization (n= 5 rats) kHz
 kHz")
39
Sash

40
16kHz @50dB: 35 % 1.9 55 % 5.3 (p<0.0005) Tone Frequency (kHz)
 Tone Frequency (kHz)")
41
Sensory experience can alter: Cortical Topography Maximum Following Rate Receptive Field Size Response Strength Synchronization Spectrotemporal Selectivity

42
How does discrimination of complex sounds alter auditory cortex? Two months of training on one of six Go-No go tasks Anesthetized high density microelectrode mapping

43
100ms 20ms High Tone (12 kHz) Low Tone (5 kHz) Noise Burst CS+ CS-’s Task Schematic
 Low Tone (5 kHz) Noise Burst CS+ CS-’s Task Schematic")
44
Experimental group # Rats # A1 Sites A) Naïve Controls7329 B) Sound Exposure Controls4263 C) Frequency Discrimination8444 D) HLN Detection Task4251 E) HLN vs. H L, or N Discrimination4253 F) HLN vs. HHH, LLL, NNN Discrimination4189 G) HLN vs. NNN, LLL, HHH Discrimination7433 H) HLN vs. NLH Reverse Discrimination5329 Totals432,491 Summary of Operant Training Experiments
 HLN vs. HHH, LLL, NNN Discrimination4189 G) HLN vs. NNN, LLL, HHH Discrimination7433 H) HLN vs. NLH Reverse Discrimination5329 Totals432,491 Summary of Operant Training Experiments.")
46
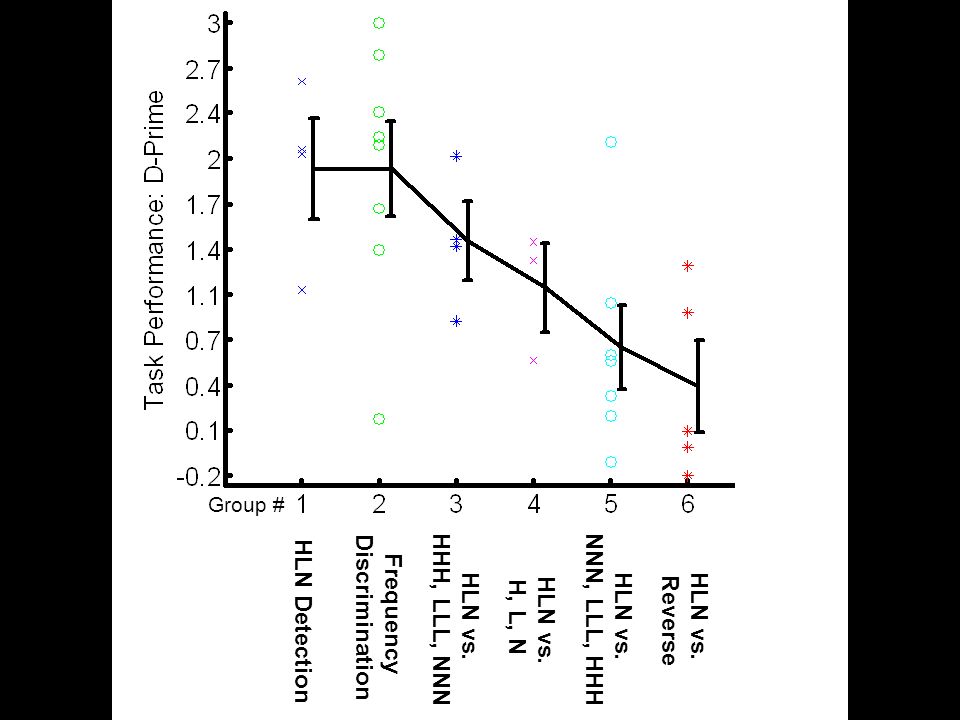
HLN Detection Frequency Discrimination HLN vs. HHH, LLL, NNN HLN vs. H, L, N HLN vs. NNN, LLL, HHH HLN vs. Reverse Group #

47
Possible results: Greater response to CS+ Map expansion HLN order preference Temporal plasticity Receptive field plasticity

48
Possible results: Greater response to CS+ Map expansion HLN order preference Temporal plasticity Receptive field plasticity

49
Naïve Control Exposure Control Detection Frequency Triplet (high first) Sequence Element Triplet (noise first) Reverse order Naïve Control Exposure Control Detection Frequency Triplet (high first) Sequence Element Triplet (noise first) Reverse order Peak Latency (msec) Bandwidth at 40dB above threshold (octaves) Onset Latency to second noise Suppression Index
 Sequence Element Triplet (noise first) Reverse order Naïve Control Exposure Control Detection Frequency Triplet (high first) Sequence Element Triplet (noise first) Reverse order Peak Latency (msec) Bandwidth at 40dB above threshold (octaves) Onset Latency to second noise Suppression Index")
50
F (2, 32) =14.2, MSE = 0.01, p < 0.0001 Exposure Control Detection Frequency Triplet (high first) Sequence Element Triplet (noise first) Reverse order
 =14.2, MSE = 0.01, p < Exposure Control Detection Frequency Triplet (high first) Sequence Element Triplet (noise first) Reverse order")
51
Nucleus Basalis Stimulation versus Natural Learning

52
Behavioral Relevance Neural Activity - Internal Representation External World -Sensory Input Neural Plasticity - Learning and Memory

53
CONCLUSIONS 1) Response strength, topography, receptive field size, maximum following rate, and spectrotemporal sensitivity are influenced by acoustic experience associated with neuromodulator release. 2) Map plasticity can endure at least 20 days. 3) Both primary and non-primary fields are plastic, but do not necessarily express the same changes. 4) Background (CS-) sounds powerfully shape the expression of cortical plasticity.
 Map plasticity can endure at least 20 days. 3) Both primary and non-primary fields are plastic, but do not necessarily express the same changes. 4) Background (CS-) sounds powerfully shape the expression of cortical plasticity..")
54
CONCLUSIONS, continued 5) Plastic changes induced using simple sounds are also evoked by exposure to complex sounds. 6) Operant training does not induce the same cortical plasticity as NB stimulation. 7) Cortical refinement is an inverted U-shaped function of task difficulty. 8) Plasticity is shaped by sensory experience, attention, and neuromodulator release.
 Operant training does not induce the same cortical plasticity as NB stimulation. 7) Cortical refinement is an inverted U-shaped function of task difficulty. 8) Plasticity is shaped by sensory experience, attention, and neuromodulator release..")
55
Enrichment A1 Experiments - Navzer Engineer Enrichment Evoked Potentials - Cherie Percaccio FM Experiments - Raluca Moucha Speech Experiments - Pritesh Pandya PAF Experiments - Amanda Puckett Time Course Experiments - Rafael Carrasco Operant Training Experiments - Navzer Engineer Crystal Novitski Acknowledgements: and

56
Behavioral Relevance Neural Activity - Internal Representation External World -Sensory Input Neural Plasticity - Learning and Memory

57
Behavioral Relevance Neural Activity - Internal Representation External World -Sensory Input Neural Plasticity - Learning and Memory Plasticity Rules - Educated Guess Behavioral Change

58
Neuron 1 Inputs to Neuron A Neuron 2 Receptive Field Overlap Neuron ANeuron B Inputs to Neuron B Spike synchronization and RF overlap are correlated. Brosch and Schreiner, 1999

59
-50-40 -30-20 -10 0 1020304050 0 200 400 600 800 1000 1200 Number of Synchronous Events Interval (msec) Cross-correlation: TC 0 25C1.MAT x TC 0 25C2.MAT Cross-correlation Shift Predictor Correlation strength = correlation peak in normalized cross-correlation histogram Correlation width = width at half height of correlation peak 250 um separation
 Cross-correlation: TC 0 25C1.MAT x TC 0 25C2.MAT Cross-correlation Shift Predictor Correlation strength = correlation peak in normalized cross-correlation histogram Correlation width = width at half height of correlation peak 250 um separation")
60
After RF increase and Map Expansion: ~85% shared inputs After Sharper Frequency Tuning: ~25% shared inputs Predicted effects of cortical plasticity on spike synchronization Before plasticity: ~50% shared inputs Before Plasticity: ~50% shared inputs Increased Correlation Decreased Correlation

61
Experience-Dependent Changes in Cortical Synchronization Map expansion increased synchronization –15pps 9kHz tone trains 50% increase in cross-correlation height (p<0.0001) 17% decrease in cross-correlation width (p<0.01) Bandwidth narrowing reduced synchronization –Two different tone frequencies 50% decrease in cross-correlation height (p<0.0001) 22% increase in cross-correlation width (p<0.001) Intermediate stimuli caused no change in synchronization –15pps tone trains with several different carrier frequencies No change in cross-correlation height or width N = 34 rats; 1,395 sites; 556 pairs
 17% decrease in cross-correlation width (p<0.01) Bandwidth narrowing reduced synchronization –Two different tone frequencies 50% decrease in cross-correlation height (p<0.0001) 22% increase in cross-correlation width (p<0.001) Intermediate stimuli caused no change in synchronization –15pps tone trains with several different carrier frequencies No change in cross-correlation height or width N = 34 rats; 1,395 sites; 556 pairs")
62
Experience-Dependent Changes in Cortical Synchronization (con’t) Enrichment also sharpened synchronization 25% increase in cross-correlation height (p<0.01) 20% decrease in cross-correlation width (p<0.01) N = 8 rats; 397 sites; 159 pairs
 Enrichment also sharpened synchronization 25% increase in cross-correlation height (p<0.01) 20% decrease in cross-correlation width (p<0.01) N = 8 rats; 397 sites; 159 pairs")
63
Time Frequency Example Speech Stream

67
* * * = p< 0.05 ** = p< 0.01 *** = p< 0.001

68
** *** * ** ***

70
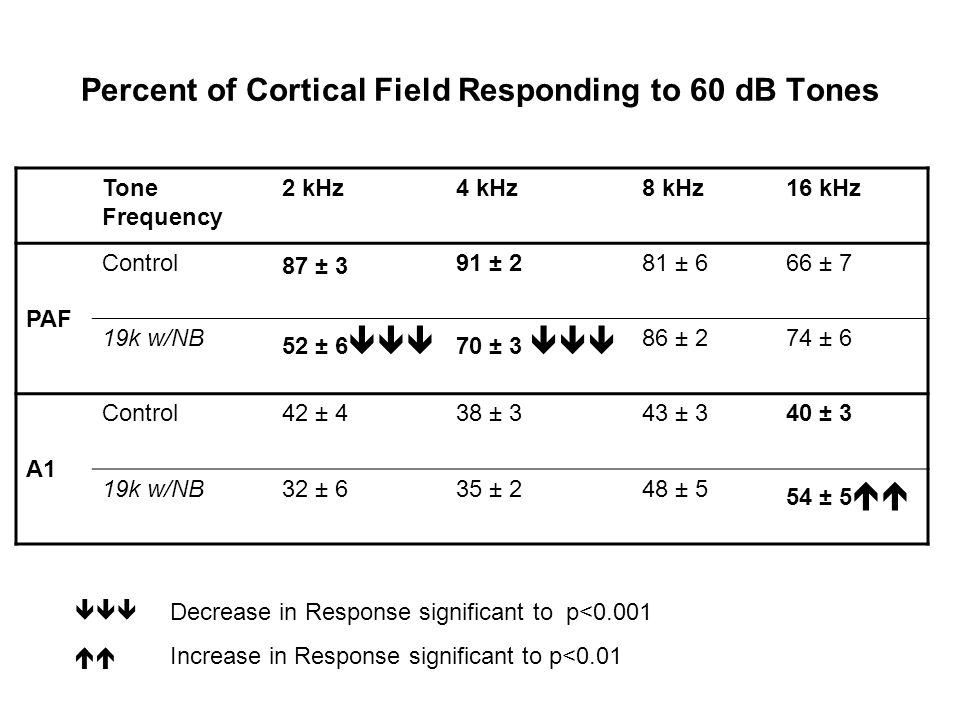
Percent of Cortical Field Responding to 60 dB Tones Tone Frequency 2 kHz4 kHz8 kHz16 kHz PAF Control 87 ± 3 91 ± 281 ± 666 ± 7 19k w/NB 52 ± 6 70 ± 3 86 ± 274 ± 6 A1 Control42 ± 438 ± 343 ± 340 ± 3 19k w/NB32 ± 635 ± 248 ± 5 54 ± 5 Decrease in Response significant to p<0.001 Increase in Response significant to p<0.01

76
Enriched Housing Standard Housing

77
12 rats per group Plasticity Index 1X 2X Enriched Standard NB Lesion Enriched NB Lesion Standard Sham Enriched Sham Standard Exercise Social Auditory Exposure

78
METHODS Stimulating Electrode Location from Bregma: 3.3 mm Lateral 2.3 mm Posterior 7.0 mm Ventral Location of reference points used to record EEG activity prior, during and after each stimulation. This information was used to confirm the efficacy of NB activation

79
NUCLEUS BASALIS ACTIVATION EEG Desynchronization Caused by NB Stimulation EEG VOLTAGE (mV) TIME (msec) The stimulation currents levels (70- 150 μAmps) were individually established to be the minimum necessary to briefly desyncronize the EEG during slow wave sleep. The stimulation consisted of a train of twenty biphasic pulses (100 Hz, 0.1 msec pulse width) 19 kHz tone @ 50dB 250 msec duration
 19 kHz 50dB 250 msec duration.")
80
Behavioral Relevance Neural Activity - Internal Representation External World -Sensory Input Neural Plasticity - Learning and Memory Plasticity Rules - Educated Guess Behavioral Change

82
Amphetamine, haloperidol, and experience interact to affect rate of recovery after motor cortex injury Feeney, Gonzalez, Law, Science. 1982 Aug 27;217(4562):855-7. Beam Scoring 7 = traversed normally with <2 slips 6 = traversed using affected limbs to aid >50% of the steps 5 = traversed using affected limbs to aid <50% of the steps 4 = traversed and placed affected hind paw on horizontal surface at least once 3 = traversed dragging affected hind limb 2 = unable to traverse but placed hind limb on horizontal surface at least once 1 = unable to traverse and unable to place hind limb on horizontal surface
: Beam Scoring 7 = traversed normally with <2 slips 6 = traversed using affected limbs to aid >50% of the steps 5 = traversed using affected limbs to aid <50% of the steps 4 = traversed and placed affected hind paw on horizontal surface at least once 3 = traversed dragging affected hind limb 2 = unable to traverse but placed hind limb on horizontal surface at least once 1 = unable to traverse and unable to place hind limb on horizontal surface.")
84
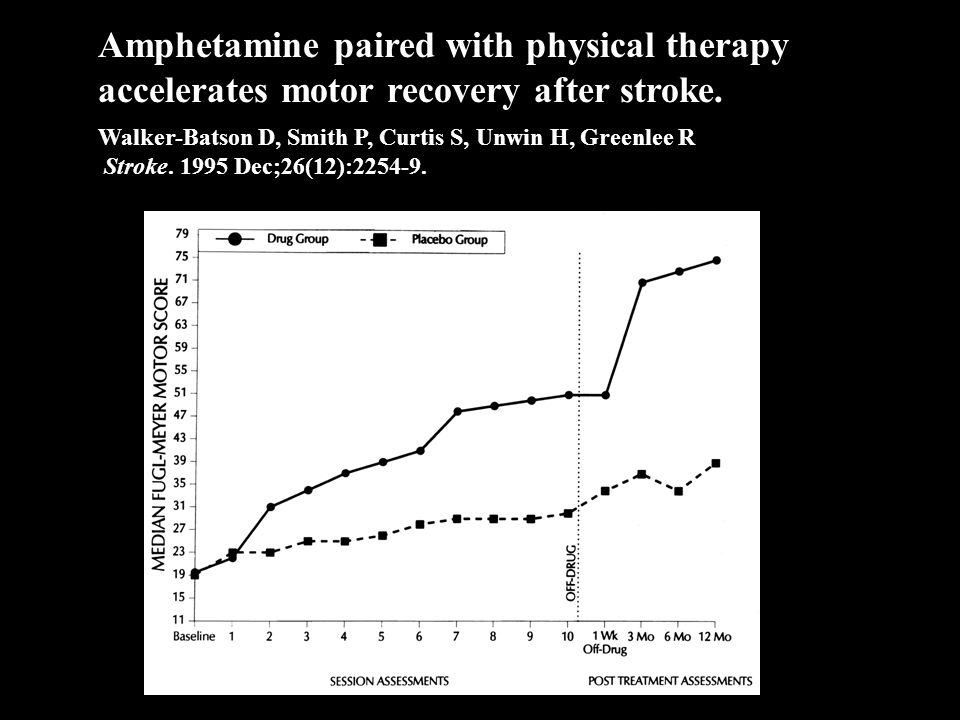
Amphetamine paired with physical therapy accelerates motor recovery after stroke. Walker-Batson D, Smith P, Curtis S, Unwin H, Greenlee R Stroke. 1995 Dec;26(12):2254-9.
:")
85
25% of sites respond with more spikes to the low tone when preceded by the high tone, compared to 5% of sites in naïve animals. (p< 0.005) 10% of sites respond with more spikes to the high tone when preceded by the low tone, compared to 13% of sites in naïve animals. 58% of sites respond with more spikes to the noise when preceded by the high and low tones, compared to 35% in naïve animals. (p< 0.01) Context-Dependent Facilitation - Group Data N = 13 rats, 261 sites Proceedings of the National Academy of Sciences, 2002 100ms20ms High Tone (12 kHz) Low Tone (5 kHz) Noise Burst
 10% of sites respond with more spikes to the high tone when preceded by the low tone, compared to 13% of sites in naïve animals. 58% of sites respond with more spikes to the noise when preceded by the high and low tones, compared to 35% in naïve animals. (p< 0.01) Context-Dependent Facilitation - Group Data N = 13 rats, 261 sites Proceedings of the National Academy of Sciences, ms20ms High Tone (12 kHz) Low Tone (5 kHz) Noise Burst.")
86
Simple to Complex Sounds Primary Auditory Cortex is strongly influenced by acoustic experience –Enrichment – LTP & PPD –NB map plasticity Frequency specificity Time course PAF vs. A1 –Temporal plasticity Faster or slower –Complex sounds and CS- (or distractors) FM and twitter Combination sensitivity Speech –Summary What about natural learning? –Edeline, Weinberger, Recanzone, Wang, Merzenich, Fritz, Shamma, and others… –Neurons respond better (more strongly and/or synchronously) to CS+ vs. CS- 2 exceptions visual cortex and frequency discrimination in cats Need to test with more tasks and more subjects –We expected forms of plasticity seen in above summary –Despite clear learning, we see no evidence of selective response to CS+ over CS-. –Instead we see inverted-U function relating task difficulty and plasticity Neuromodulators and experience RULE Extra xcorr Hopkins 2005 Outline
 FM and twitter Combination sensitivity Speech –Summary What about natural learning. –Edeline, Weinberger, Recanzone, Wang, Merzenich, Fritz, Shamma, and others… –Neurons respond better (more strongly and/or synchronously) to CS+ vs. CS- 2 exceptions visual cortex and frequency discrimination in cats Need to test with more tasks and more subjects –We expected forms of plasticity seen in above summary –Despite clear learning, we see no evidence of selective response to CS+ over CS-. –Instead we see inverted-U function relating task difficulty and plasticity Neuromodulators and experience RULE Extra xcorr Hopkins 2005 Outline.")
Similar presentations


 Stimulus to response (1-2) Response to stimulus, information in spikes (3-4) Part 2: Neurons.>")


