Download presentation
Presentation is loading. Please wait.

1
Office of Accountability, Planning and Technology Overview of MCAS Results and Adequate Yearly Progress Determinations 2007 Brockton School Committee November 20, 2007

2
Office of Accountability, Planning and Technology 2007 MCAS Release & AYP Determinations – Key Dates August 20 – 31 –MCAS Discrepancy Reporting Window (www.mcasservicecenter.com) August 27 – September 7 –AYP Discrepancy Reporting Window (DOE Security Portal) September 13 –Public Release of Lists of Schools & Districts Identified for Improvement, Corrective Action or Restructuring September 25 –Public Release of Preliminary AYP Reports for Schools (Not Including Pre-K to Grade 2 Schools & Other Special Cases) October 18 –Public Release of All School & District AYP Reports
 September 13 –Public Release of Lists of Schools & Districts Identified for Improvement, Corrective Action or Restructuring September 25 –Public Release of Preliminary AYP Reports for Schools (Not Including Pre-K to Grade 2 Schools & Other Special Cases) October 18 –Public Release of All School & District AYP Reports")
3
Office of Accountability, Planning and Technology Overview of 2007 MCAS results Grades and subjects tested State and district gains since 1998 State and district 2006/2007 passing and proficiency rate comparisons 3

4
Office of Accountability, Planning and Technology 4 MCAS Tested Areas 1998-2006

5
Office of Accountability, Planning and Technology 5 MCAS Tested Areas 1998-2006

6
Office of Accountability, Planning and Technology 6 COMPARING MCAS GAINS STATEBROCKTON Pass Grade 10 ELA22%35% Grade 10 Math43%56% Grade 8 Math17%28% Grade 4 Math10%20% Grade 4 ELA9%13% Comparison of the 10-year gains in Passing and Advanced/Proficient rates 1998 – 2007 No other MCAS exam has been given annually to the same grades since 1998.

7
Office of Accountability, Planning and Technology 7 COMPARING MCAS GAINS STATEBROCKTON Adv/Prof Grade 10 ELA33%38% Grade 10 Math45%43% Grade 8 Math14%10% Grade 4 Math14%17% Grade 4 ELA36%33% Comparison of the 10-year gains in Passing and Advanced/Proficient rates 1998 – 2007

8
Office of Accountability, Planning and Technology 8 COMPARING MCAS GAINS STATEBROCKTON PassAdv/ProfPassAdv/Prof Grade 10 ELA22%33%35%38% Grade 10 Math43%45%56%43% Grade 8 Math17%14%28%10% Grade 4 Math10%14%20%17% Grade 4 ELA9%36%13%33% No other MCAS exam has been given annually to the same grades since 1998. Comparison of the 10-year gains in Passing and Advanced/Proficient rates 1998 – 2007

9
Office of Accountability, Planning and Technology advanced/proficient passing BROCKTON STATE advanced/proficient passing

10
Office of Accountability, Planning and Technology

11
STATE

12
Office of Accountability, Planning and Technology STATE

13
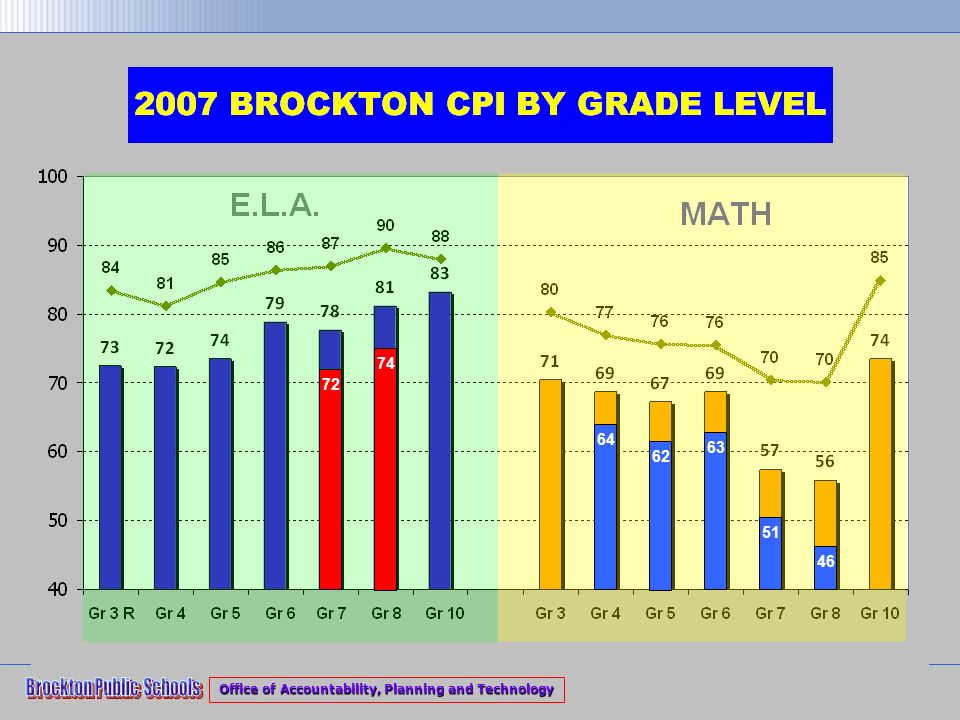
Office of Accountability, Planning and Technology CPI | Composite Proficiency Index CPI is … 2007 CPI for grade levels 2007 CPI for subgroups 2007 CPI for state and large urban districts District and state CPI over time – closing the gap 13

14
Office of Accountability, Planning and Technology The CPI (Composite Performance Index) is – a metric that Massachusetts uses to measure school and district performance and improvement; a 100-point index that combines the scores of students who participate in standard MCAS ELA and mathematics tests, and those who participate in the MCAS-Alt. MCAS Performance Level Scaled Score Range MCAS-Alt Performance Level Points Per Student Proficient or Advanced240 – 280Progressing100 Needs Improvement High230 – 238Emerging75 Needs Improvement Low220 – 228Awareness50 Warning / Failing High210 – 218 Portfolio Incomplete25 Warning / Failing Low200 – 208 Portfolio not Submitted0 OR

15
Office of Accountability, Planning and Technology CPI=Composite Performance Index TABLE 1 MCAS Scaled Score Points 200 – 208 Failing/Warning – Low0 210 – 218 Failing/Warning – High25 220 – 228 Needs Improvement – Low50 230 – 238 Needs Improvement – High75 240 – 280 Proficient/Advanced100 15 TABLE 2 - Students taking Standard MCAS tests 100 students Performance Level Total Points 5 Failing – Low00 5 Failing – High25125 20 Needs Improvement - Low501000 40 Needs Improvement – High 753000 25 Proficient1002500 5 Advanced100500 Total Points Awarded7,125 Total # of Students Tested100 CPI (Total Points divided by Total Students) Index Points 71.3
 Index Points 71.3")
16
Office of Accountability, Planning and Technology The CPI (Composite Performance Index) is – a metric that Massachusetts uses to measure school and district performance and improvement; a 100-point index that combines the scores of students who participate in standard MCAS ELA and mathematics tests, and those who participate in the MCAS-Alt. MCAS Performance Level Scaled Score Range MCAS-Alt Performance Level Points Per Student Proficient or Advanced240 – 280Progressing100 Needs Improvement High230 – 238Emerging75 Needs Improvement Low220 – 228Awareness50 Warning / Failing High210 – 218 Portfolio Incomplete25 Warning / Failing Low200 – 208 Portfolio not Submitted0 OR

17
Office of Accountability, Planning and Technology

20
51 46 63 62 64 72 74
21
Office of Accountability, Planning and Technology State & Brockton 2007 Mid-Cycle V CPI Gains in English Language Arts State & Brockton 2007 Mid-Cycle V CPI for English Language Arts

22
Office of Accountability, Planning and Technology State & Brockton 2007 Mid-Cycle V CPI for Mathematics State & Brockton 2007 Mid-Cycle V CPI Gains in Mathematics

23
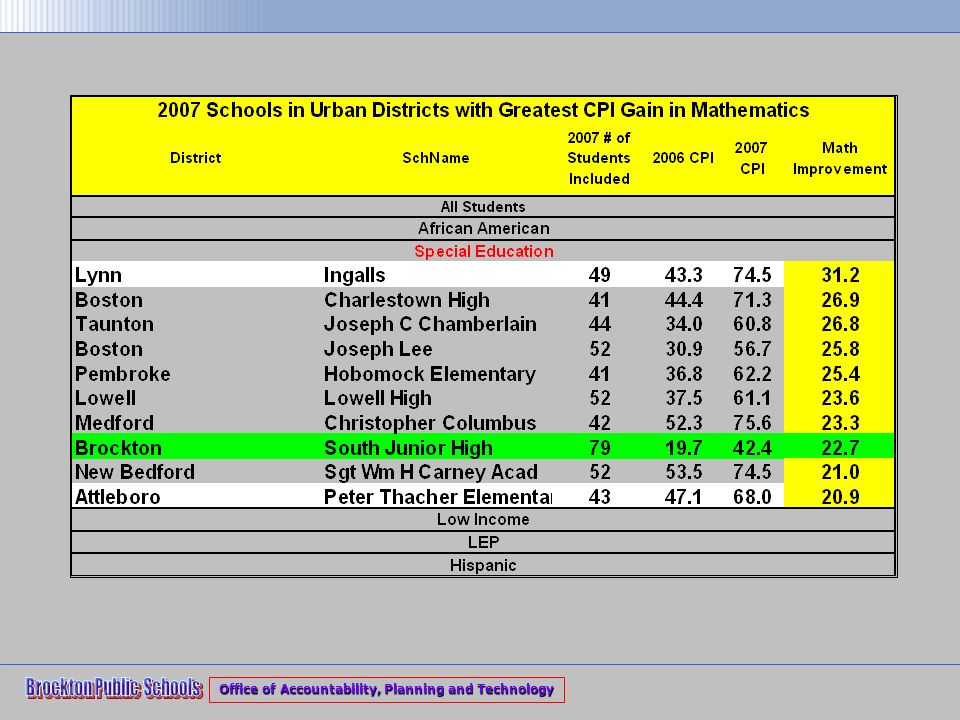
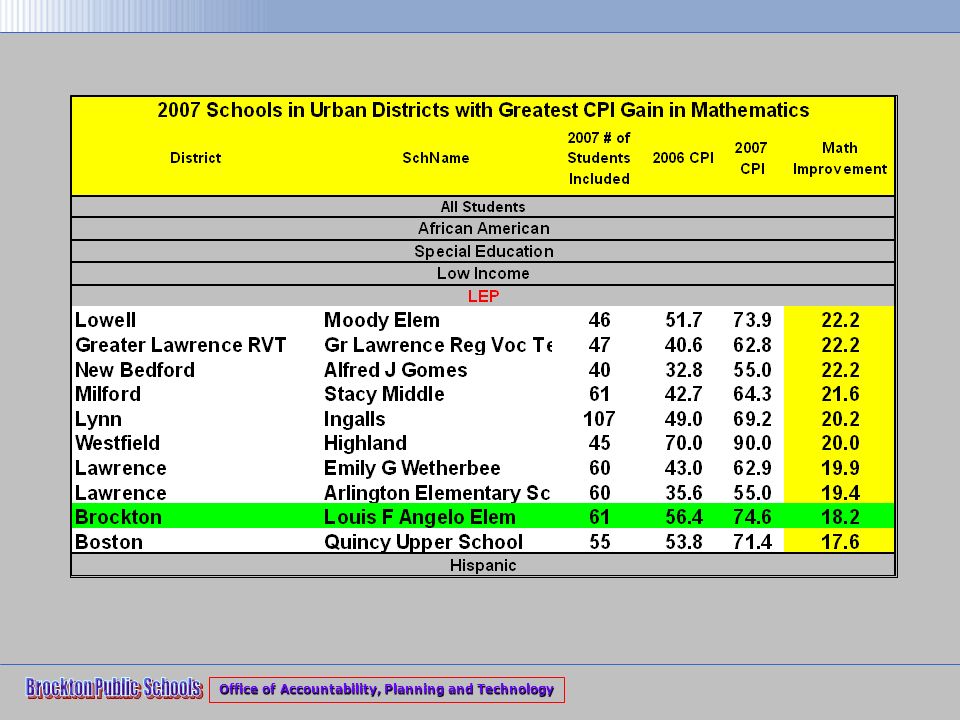
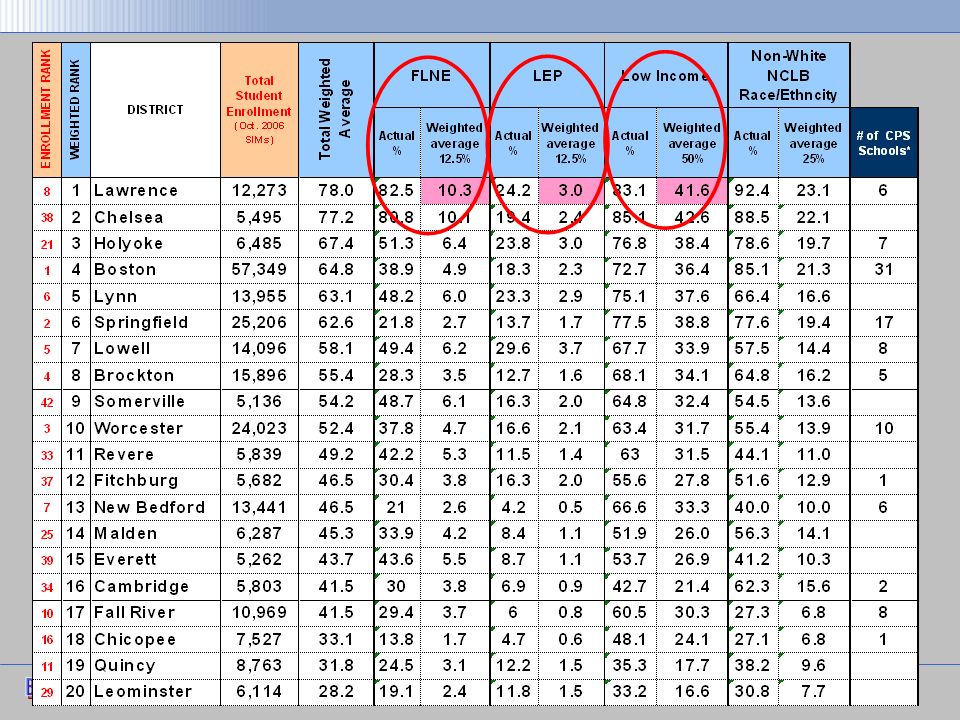
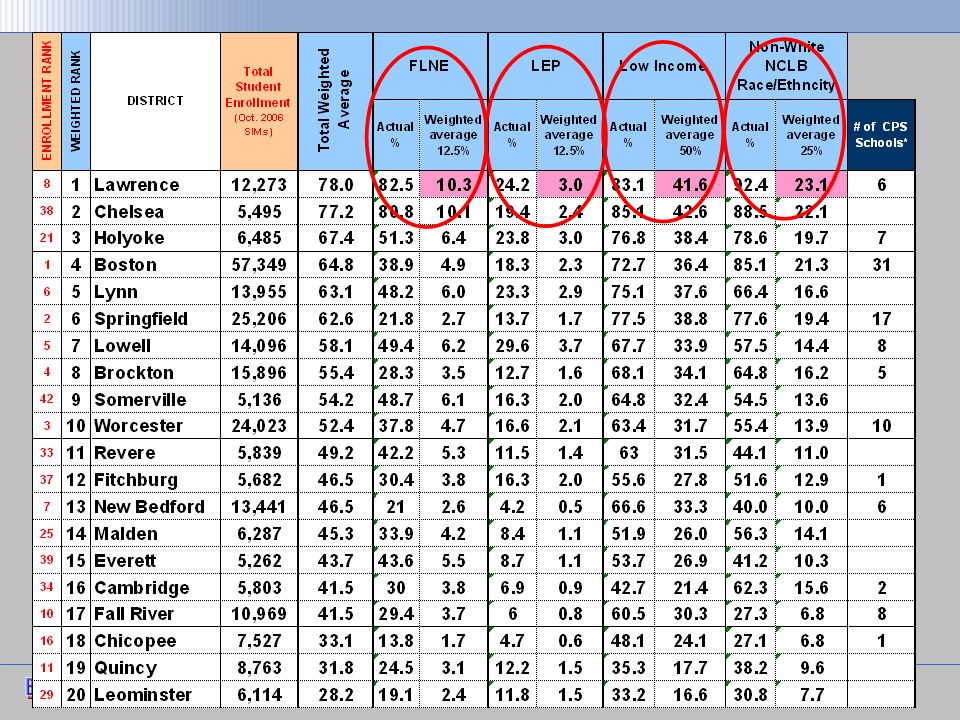
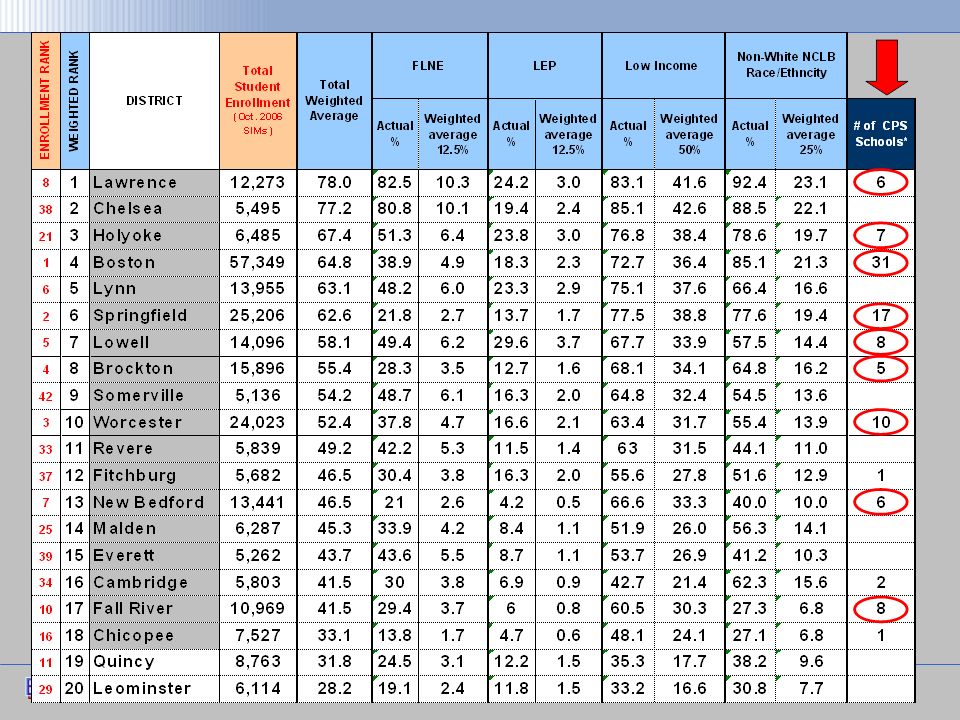
Office of Accountability, Planning and Technology Massachusetts Top 10

24
Office of Accountability, Planning and Technology

29
76.2

30
Office of Accountability, Planning and Technology SIX-YEAR DISTRICT AND STATE CPI COMPARISON FOR ENGLISH LANGUAGE ARTS STATE 5-YEAR GAIN = 4.6 BROCKTON 5-YEAR GAIN = 9.2 13.4 8.8

31
Office of Accountability, Planning and Technology SIX-YEAR DISTRICT AND STATE CPI COMPARISON FOR MATHEMATICS 2002 2003 2004 2005 2006 2007 STATE 5-YEAR GAIN = 10.8 BROCKTON 5-YEAR GAIN = 15.0 14.8 10.6

32
Office of Accountability, Planning and Technology AYP | Adequate Yearly Progress ABCs of AYP calculation Massachusetts context Urban challenges Identification/accountability status “Commissioner’s Districts” BPS Performance – A Good Story Projections – beyond 2007 32

33
Office of Accountability, Planning and Technology How is AYP calculated? (100 – Cycle V CPI) / 4 33
 / 4 33")
34
Office of Accountability, Planning and Technology 34

35
Office of Accountability, Planning and Technology Which sentence tells a fact, not an opinion? A.Cats are better than dogs. B.Cats climb trees better than dogs. C.Cats are prettier than dogs. D.Cats have a nicer fur than dogs. Read the excerpt from “How Much Land Does Man Need?” by Leo Tolstoy. So Pahom was well contented, and everything would have been right if the neighboring peasants would only not have trespassed on his wheatfields and meadows. He appealed to them most civilly, but they still went on: now the herdsmen would let the village cows stray into his meadow, then horses from the night pasture would get among his corn. Pahom turned them out again and again, and forgave their owners, and for a long time he forbore to prosecute anyone. But at last he lost patience and complained to the District Court. What is a fact from this passage? A.Pahom owns a vast amount of land. B.The peasant’s intentions are evil. C.Pahom is a wealthy man. D.Pahom complained to the District Court.

36
Office of Accountability, Planning and Technology 2007 NAEP Results in Top Performing States by Scaled Score: Grade 4 Average Scaled Scores and Percents of Students at Each Achievement Level Average Scaled Score Percent of Students Advanced Proficient and above Basic and above Below Basic READING 1 Massachusetts23616498119 2 New Jersey23112437723 3 New Hampshire22911417624 4 Vermont22811417426 5 Connecticut22712417327 6 Virginia2279387426 7 Montana2278397525 8 Pennsylvania22611407327 9 North Dakota2266357525 10 Ohio2268367327 National Public2207326634 MATHEMATICS 1 Massachusetts2521158937 2 New Jersey2499529010 3 New Hampshire249952919 4 Kansas2489518911 5 Minnesota2479518713 6 Vermont2467498911 7 North Dakota245546919 8 Indiana2456468911 9 Ohio2457468713 10 Wisconsin2447478515 National Public2395398119

37
Office of Accountability, Planning and Technology 2007 NAEP Results in Top Performing States by Scaled Score: Grade 8 Average Scaled Scores and Percents of Students at Each Achievement Level Scaled Score Percent of Students Advanced Proficient and above Basic and above Below Basic READING 1 Massachusetts2734438416 2 Vermont2734428416 3 Montana2712398515 4 New Jersey2704398119 5 Maine2703378317 6 New Hampshire2703378218 7 South Dakota2702378317 8 Minnesota2683378020 9 North Dakota2681328416 National Public261229 7327 MATHEMATICS 1 Massachusetts29815518515 2 Minnesota29211438119 3 North Dakota2927418614 4 Vermont29110418119 5 Kansas2909408119 6 New Jersey28910407723 7 South Dakota2887398119 8 Virginia2889377723 9 New Hampshire2888387822 10 Montana2877387921 National Public 2807317030

38
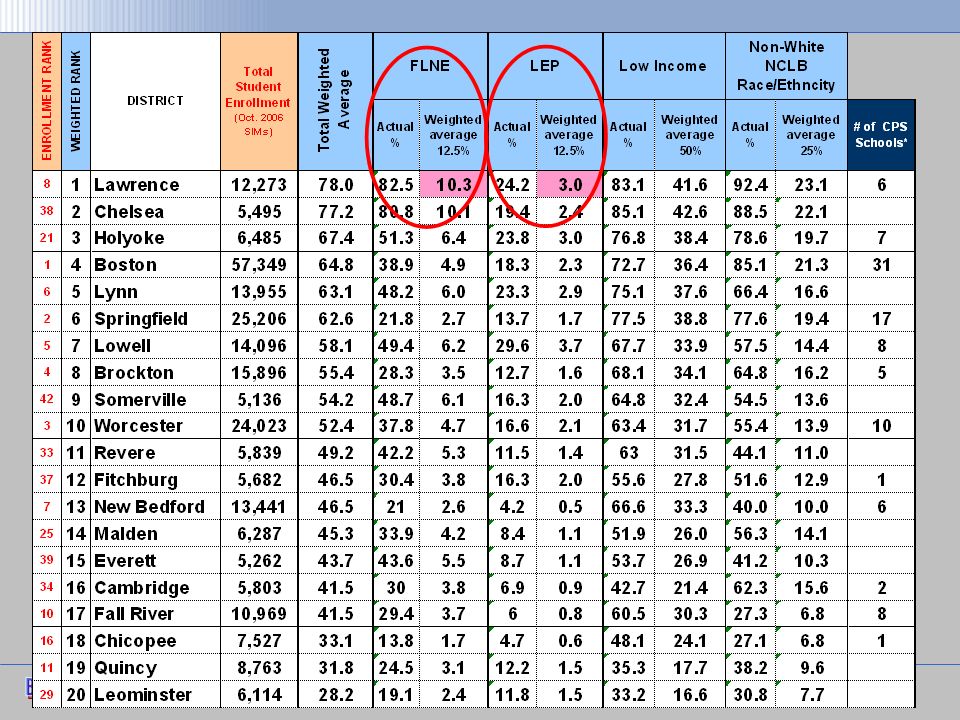
Office of Accountability, Planning and Technology Urban challenges – language, poverty, achievement gap

39
Office of Accountability, Planning and Technology

46
Commissioner’s Districts

47
Office of Accountability, Planning and Technology

50
Sample district AYP history table 50 Old method 2001-2005 Old method New method introduced in 2006 New method introduced in 2006

51
Office of Accountability, Planning and Technology

52
Nine districts identified for corrective action – aggregate Everett Holbrook Holyoke Lawrence Leominster Lynn New Bedford Somerville Springfield 52

53
Office of Accountability, Planning and Technology Twenty-seven districts identified for corrective action - subgroups AmherstGreenfieldPittsfield BostonHaverhillPlymouth Bridgewater-RaynhamLowellRevere BROCKTONLudlowSalem ChicopeeMaldenSouthbridge Fall RiverMarlboroughWareham FalmouthMedfordWestfield GardnerMethuenWoburn GloucesterPeabodyWorcester 53

54
Office of Accountability, Planning and Technology

55
Statewide percent of all schools not making AYP in ELA or Math AGGREGATE24.9% SUBGROUPS Limited English Proficient57.0% Special Education62.8% Low Income51.8% African-American46.7% Asian/Pacific Islander14.6% Hispanic54.3% White14.6% 55

56
Office of Accountability, Planning and Technology SCHOOL Accountability Status 20022003200420052006 2007 Total Schools: 1792######% Restructuring - Aggregate-- 243060774.3 Corrective Action - Aggregate--38283749251.4 Identified for Improvement - Aggregate20816812813120820111.2 Subtotal - Aggregate20820618019831730316.9 Restructuring - Subgroups-- 1146.4 Corrective Action - Subgroups-- 139925.1 Identified for Improvement - Subgroups-- 1932221741659.2 Subtotal - Subgroups19322231337120.7 Total20820637342063067437.6 2007 Adequate Yearly Progress (AYP) Data - Massachusetts School Accountability Status
 Data - Massachusetts School Accountability Status")
57
Office of Accountability, Planning and Technology SCHOOL Accountability Status 20022003200420052006 2007 Total Schools: 1792######% Restructuring – Aggregate-- 243060774.3 Corrective Action – Aggregate--38283749251.4 Identified for Improvement – Aggregate20816812813120820111.2 Subtotal – Aggregate20820618019831730316.9 Restructuring – Subgroups-- 1146.4 Corrective Action – Subgroups-- 139925.1 Identified for Improvement – Subgroups-- 1932221741659.2 Subtotal – Subgroups19322231337120.7 Total20820637342063067437.6 2007 Adequate Yearly Progress (AYP) Data - Massachusetts School Accountability Status
 Data - Massachusetts School Accountability Status")
58
Office of Accountability, Planning and Technology SCHOOL Accountability Status 20022003200420052006 2007 Total Schools: 1792######% Restructuring – Aggregate-- 243060774.3 Corrective Action – Aggregate--38283749251.4 Identified for Improvement – Aggregate20816812813120820111.2 Subtotal – Aggregate20820618019831730316.9 Restructuring – Subgroups-- 1146.4 Corrective Action – Subgroups-- 139925.1 Identified for Improvement – Subgroups-- 1932221741659.2 Subtotal – Subgroups19322231337120.7 Total20820637342063067437.6 2007 Adequate Yearly Progress (AYP) Data - Massachusetts School Accountability Status
 Data - Massachusetts School Accountability Status")
59
Office of Accountability, Planning and Technology SCHOOL Accountability Status 20022003200420052006 2007 Total Schools: 1792 Brockton######% Restructuring – Aggregate 1-- 243060774.3 Corrective Action – Aggregate 1--38283749251.4 Identified for Improvement – Aggregate 820816812813120820111.2 Subtotal – Aggregate 1020820618019831730316.9 Restructuring – Subgroups 4-- 1146.4 Corrective Action – Subgroups 3-- 139925.1 Identified for Improvement – Subgroups 2-- 1932221741659.2 Subtotal – Subgroups 919322231337120.7 Total 1920820637342063067437.6 2007 Adequate Yearly Progress (AYP) Data - Massachusetts School Accountability Status
 Data - Massachusetts School Accountability Status")
60
Office of Accountability, Planning and Technology Sample 2007 School AYP Report – Detailed Data

61
Office of Accountability, Planning and Technology ELA Status ELA AYP Aggregate ELA AYP Sub- groups 2007 Math Status Math AYP Aggregate Math AYP Sub- groups AngeloI-A1Yes No StatusYes ArnoneI-A2No CA-SNo AshfieldI-A1No I-A1No Belmont StreetI-A2No CA-ANo BrookfieldI-S2YesNoI-S2YesNo DavisI-A1No No StatusNo DowneyI-A2No 1-S1YesNo FranklinI-A1Yes I-A1Yes HancockI-A2Yes No StatusYes HuntingtonCA-ANo I-A2Yes KennedyI-A2No I-A1Yes PlouffeI-S2YesNoI-S2YesNo RaymondI-S2No CA-SNo WhitmanI-A1Yes No StatusYes East Junior HighCA-SYes R-S1YesNo North Junior HighCA-SYesNoR-S1YesNo South Middle SchoolI-S2YesNoR-S1YesNo West Junior HighNo StatusNo R-A1No Brockton High SchoolCA-SNo R-S1No

62
Office of Accountability, Planning and Technology ELA Status ELA AYP Aggregate ELA AYP Sub- groups 2007 Math Status Math AYP Aggreg-ate Math AYP Sub- groups AngeloI-A1Yes No StatusYes ArnoneI-A2No CA-SNo AshfieldI-A1No I-A1No Belmont StreetI-A2No CA-ANo BrookfieldI-S2YesNoI-S2YesNo DavisI-A1No No StatusNo DowneyI-A2No 1-S1YesNo FranklinI-A1Yes I-A1Yes HancockI-A2Yes No StatusYes HuntingtonCA-ANo I-A2Yes KennedyI-A2No I-A1Yes PlouffeI-S2YesNoI-S2YesNo RaymondI-S2No CA-SNo WhitmanI-A1Yes No StatusYes East Junior HighCA-SYes R-S1YesNo North Junior HighCA-SYesNoR-S1YesNo South Middle SchoolI-S2YesNoR-S1YesNo West Junior HighNo StatusNo R-A1No Brockton High SchoolCA-SNo R-S1No

63
Office of Accountability, Planning and Technology ELA Status ELA AYP Aggregate ELA AYP Sub- groups 2007 Math Status Math AYP Aggreg-ate Math AYP Sub- groups AngeloI-A1Yes No StatusYes ArnoneI-A2No CA-SNo AshfieldI-A1No I-A1No Belmont StreetI-A2No CA-ANo BrookfieldI-S2YesNoI-S2YesNo DavisI-A1No No StatusNo DowneyI-A2No 1-S1YesNo FranklinI-A1Yes I-A1Yes HancockI-A2Yes No StatusYes HuntingtonCA-ANo I-A2Yes KennedyI-A2No I-A1Yes PlouffeI-S2YesNoI-S2YesNo RaymondI-S2No CA-SNo WhitmanI-A1Yes No StatusYes East Junior HighCA-SYes R-S1YesNo North Junior HighCA-SYesNoR-S1YesNo South Middle SchoolI-S2YesNoR-S1YesNo West Junior HighNo StatusNo R-A1No Brockton High SchoolCA-SNo R-S1No

64
Office of Accountability, Planning and Technology Sample 2007 School AYP Report – Summary Data

65
Office of Accountability, Planning and Technology

66
Projected path in ELA Projected path in Math 66 77.0 75.6

67
Office of Accountability, Planning and Technology END 67 Office of Accountability, Planning and Technology

68
68 Office of Accountability, Planning and Technology

69
69 Office of Accountability, Planning and Technology

70
2006 ELA CPI FOR LARGE URBAN DISTRICTS 70

71
Office of Accountability, Planning and Technology 2006 MATHEMATICS CPI FOR LARGE URBAN DISTRICTS 71

Similar presentations


 Determinations Massachusetts Department of Education August, 2005.>")


 1 Hal Sanderson, Ph.D. Research and Assessment August 21, 2013 2013.>")

 Information Session Juliane Dow, Associate Commissioner Accountability & Targeted Assistance Massachusetts Department of.>")
 & CAHSEE 2009-10 Results Update Prepared for the September 21, 2010 Board of Education.>")
 and Accountability Status Determinations Massachusetts Department of Elementary and Secondary Education October 2008.>")


>")