Download presentation
Presentation is loading. Please wait.

2
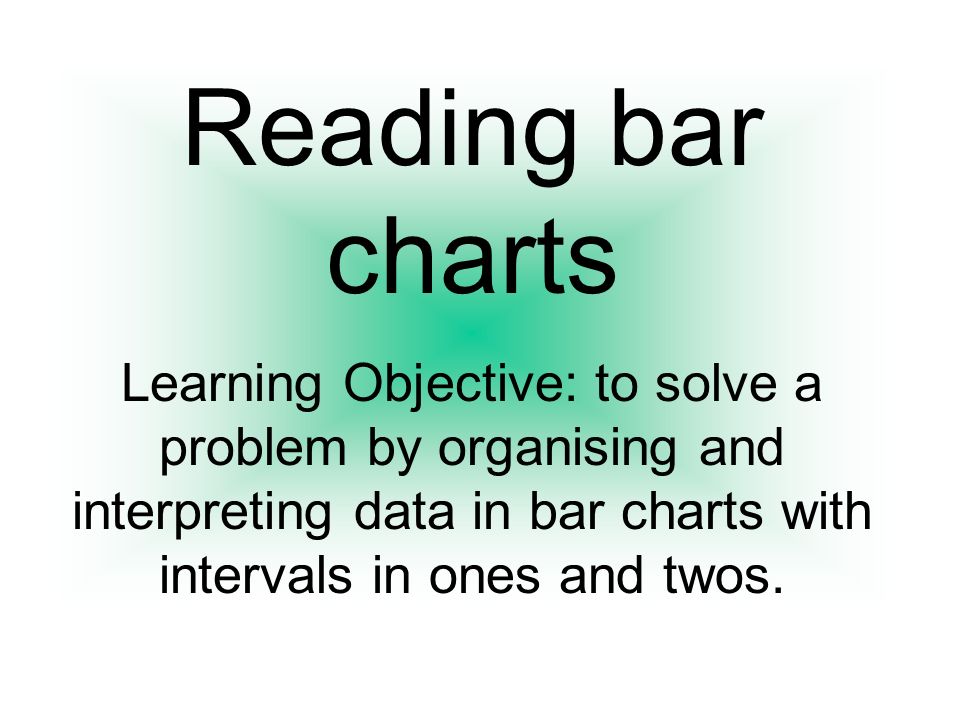
Reading bar charts Learning Objective: to solve a problem by organising and interpreting data in bar charts with intervals in ones and twos.

3
Look at the way a bar chart is constructed. Can you name its different parts? What goes here? What is this called? What do we call this? What is this?

4
Horizontal axis (x). Always labelled. Vertical axis (y). Always labelled and numbered. A bar chart always has a title. The height of the bars show how many of something was scored/recorded.

5
Can you read the answers? Flavours Number of children Favourite Crisps Salt and vinegar Cheese and onion Prawn cocktail Ready salted Mexican Chilli Worcester sauce Barbeque What does this bar chart show? How many children were surveyed? Which is the favourite flavour? Which is the least liked? What intervals are used on the y axis? What intervals could you use if twice as many children were surveyed? 0 1 2 3 4 5 6 7 8

6
How can you collect the information needed to construct a bar chart? By making a tally chart first!

7
Salt and vinegar1111 Cheese and onion1111 111 Prawn cocktail1 Ready salted11 Mexican Chilli1111 1 Worcester sauce111 Barbeque1111 11 Flavour Tally Insert any other flavours here

Similar presentations