Download presentation
Presentation is loading. Please wait.

1
Lepton Polarisation at HERA A brief overview of lepton polarisation - its use and measurement at HERA, including testbeam analysis of the performance of the upgraded Transverse Polarimeter (TPOL). Chris Collins-Tooth (ZEUS, IC-London)
.")
2
Outline zLepton Beam Polarisation - how, why? zMeasurement of Polarisation - currently, and in the future. zTest Beam setup of the Telescope and Transverse Polarimeter zWhat is the Telescope and what does it do? zWhat data was gathered? zAnalysis of the data yMultiple Coulomb Scattering, Beam spread, and Telescope resolution yRelative rotations xbetween parts of the Telescope xbetween the Telescope and the TPOL silicon zWhat can be done about these factors? zWhat does this tell us about the TPOL silicon - resolution,efficiency? zConclusions

3
Lepton Beam Polarisation zRelativistic e+/- emit synchrotron radiation in curved portions of a storage ring. zEmission can cause spin flip. z and flip rates differ. ze- become polarised antiparallel to the guide field, e+ become polarised parallel to field. zP(t)=P st [1-exp(-t/T st )] = (N -N )/(N +N ) zP st was ~0.51 at HERA zT st =time-constant ~20min 50 40 30 20 10 0 -10 60 P(%) t(min)
=P st [1-exp(-t/T st )] = (N -N )/(N +N ) zP st was ~0.51 at HERA zT st =time-constant ~20min P(%) t(min).")
4
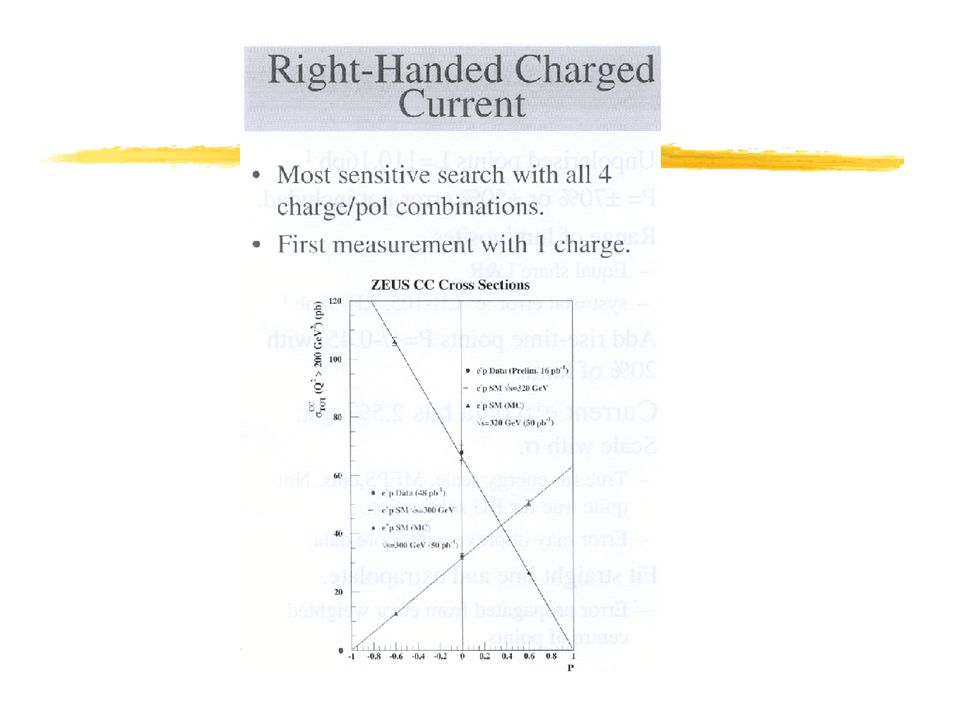
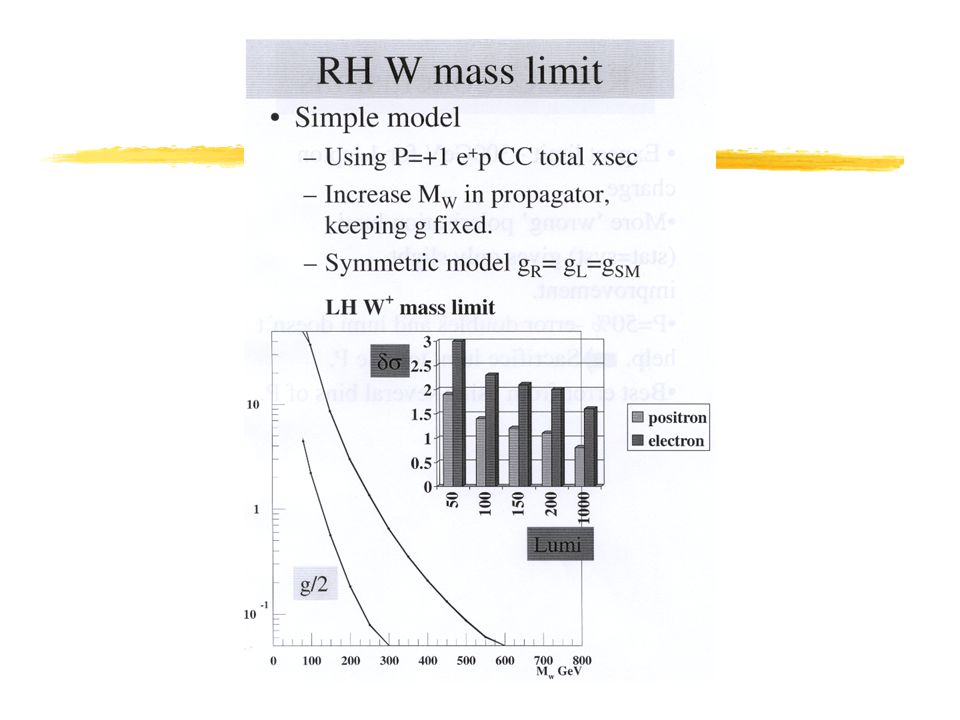
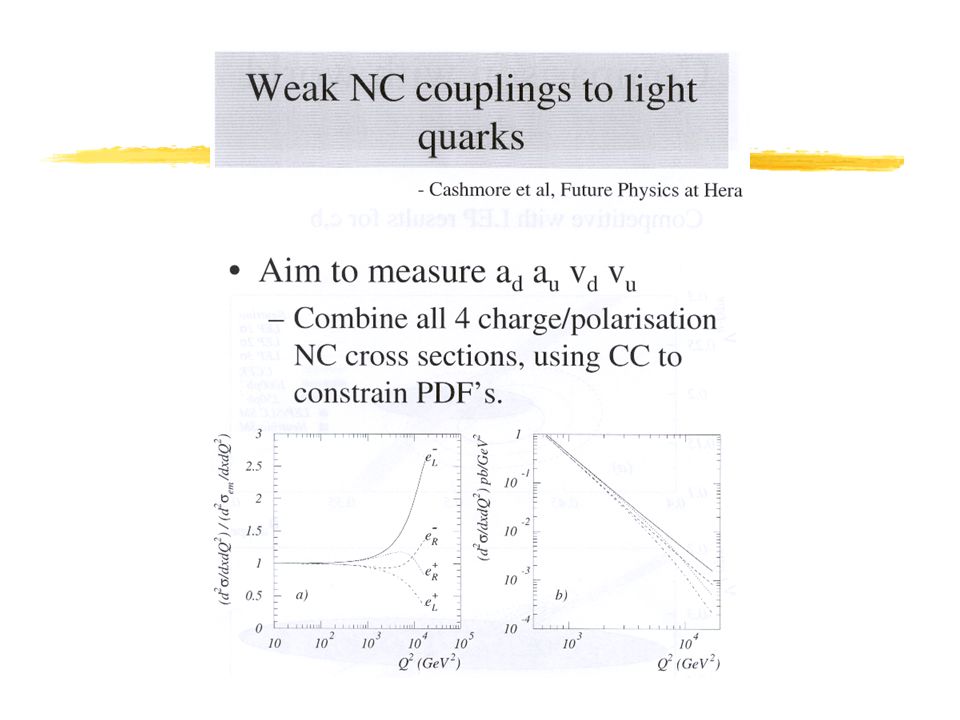
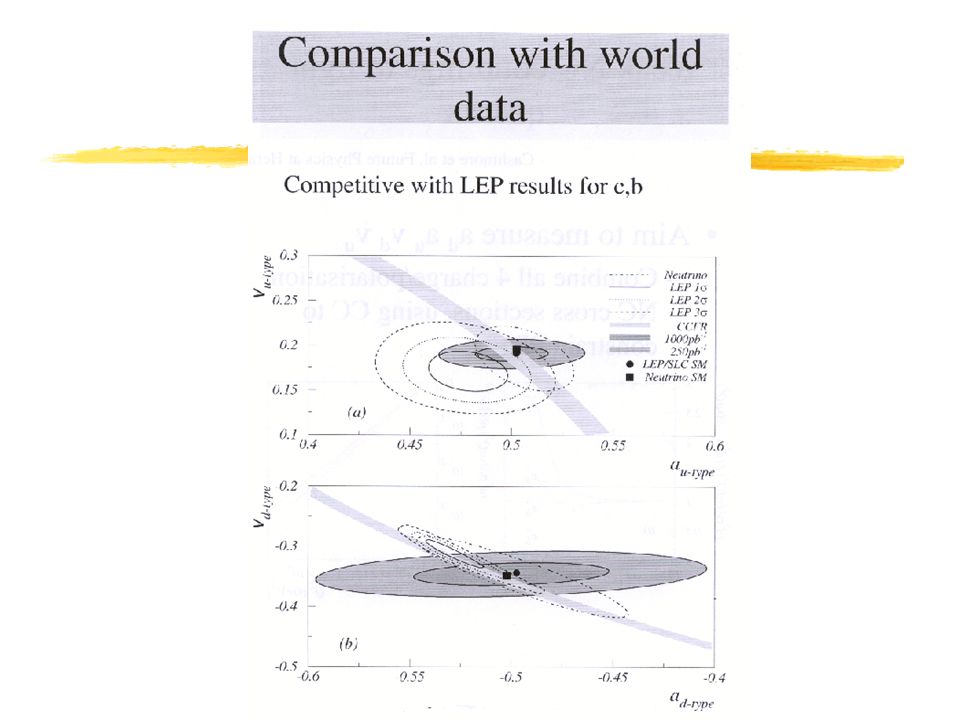
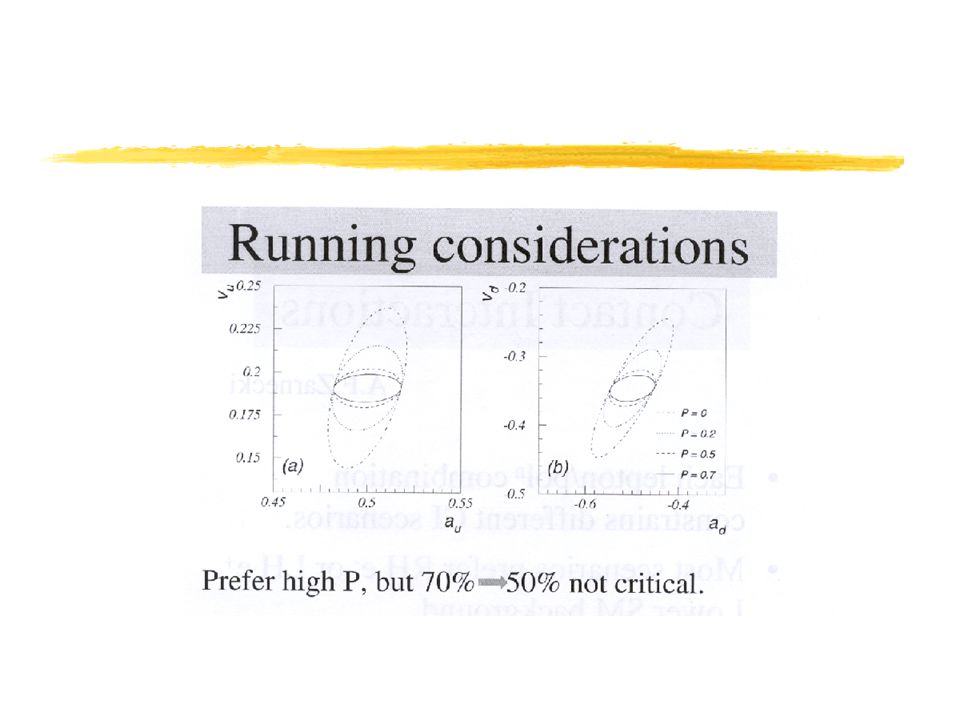
Why is polarisation important? zMore accurate knowledge of polarisation state of beam will allow ‘new physics’ to be investigated e.g.: yStandard Model: no right handed Charged Currents (W + L / W - R ). Plotting CC obs (P) allows direct measurement of right-handed W - R mass. - present limit is 720GeV set in 10/2000 by D0. Neutral Current (Z 0, ) cross sections split into 4 at high Q 2 if Leptons polarised. yThis allows measurement light quark Neutral Current couplings v u v d a u a d. (complimentary to LEP b,c quarks).
. Plotting CC obs (P) allows direct measurement of right-handed W - R mass. - present limit is 720GeV set in 10/2000 by D0. Neutral Current (Z 0, ) cross sections split into 4 at high Q 2 if Leptons polarised. yThis allows measurement light quark Neutral Current couplings v u v d a u a d. (complimentary to LEP b,c quarks)..")
5
How is polarisation currently measured? zTransversely polarised leptons collide with circularly polarised laser light to give angular asymmetry. zAngular asymmetry translates to spatial asymmetry. zCompton-scattered photons enter calorimeter. zCalorimeter is in two halves to measure up-down energy asymm. Polarisations measured to + 6% (photon position measured to within 1000 m) zUpgrade will improve accuracy.
 zUpgrade will improve accuracy..")
6
What does the prototype TPOL look like? zOnly changes to calorimeter section of TPOL. New 1cm 2 Si strip detector in front of calorimeter (80 m pitch for horizontal strips). zDue to small beam spot radiation damage may occur. zMovable scintillating fibre to calibrate Si response over ~5yr lifetime. zProduction TPOL has 6x6cm 2 Si strip detector, with horizontal and vertical strips (just tested at CERN).
. zDue to small beam spot radiation damage may occur. zMovable scintillating fibre to calibrate Si response over ~5yr lifetime. zProduction TPOL has 6x6cm 2 Si strip detector, with horizontal and vertical strips (just tested at CERN)..")
7
Test Beam setup z6 GeV e - beam enters from left ze - beam passes through Telescope then moves into the TPOL zTelescope mounted as close to TPOL as possible on movable table zTelescope has 3 position sensitive detectors T1,T2 and T3 (Td was ‘dead’ material being used for a second experiment) Telescope TPOL
 Telescope TPOL")
8
The Telescope zPreviously, degree of polarisation estimated using energy asymmetry in calorimeter (Calorimeter resolution ~1000 m) zNow measure polarisation using 80 m pitch Si zSomething more accurate needed to probe TPOL silicon resolution - the Telescope. z3 planes of 50 m pitch Si, with horizontal and vertical strips. zT1,T2,T3 detectors roughly 3cm × 3cm (TPOL silicon ~1 cm 2 )
.")
9
The data zT1,T2,T3 used to predict Si strip to fire. zAs expected, fitted line has slope =1 0.01 zOffset simply due to T1,2,3 being physically larger than TPOL Silicon zWidth of data about fitted line gives indication of TPOL resolution

10
The width zWidth =132.15 ± 2.93 m zTPOL Silicon strip pitch =80 m zIntrinsic resolution ~80/ 12 m 0 0400-400800-800

11
Analysis of the data zObserved width does not relate directly to the TPOL resolution zMultiple Coulomb Scattering (MCS) of e - beam at T1,Td,T2,T3 and TPOL Aluminium Box zFinite resolution of the Telescope ze - beam not 100% collimated zMisalignments of the Telescope detectors T1,T2,T3 zMisalignments of the Telescope (as a whole) and the TPOL
 of e - beam at T1,Td,T2,T3 and TPOL Aluminium Box zFinite resolution of the Telescope ze - beam not 100% collimated zMisalignments of the Telescope detectors T1,T2,T3 zMisalignments of the Telescope (as a whole) and the TPOL")
12
Telescope internal misalignment zT1,T2 and T3 could all be misaligned with respect to each other. zRotations would produce systematic shifts of ‘predicted minus actual’ strip firing from left-to-right zMost important are rotations about beam-axis (pictured). A 0.08 o rotation would cause a shift of 1 strip across breadth of detector
. A 0.08 o rotation would cause a shift of 1 strip across breadth of detector.")
13
‘Predicted minus Actual’ shifts for T3,T2 and T1 from L R zUsing T1,T2 to predict T3 (left) we observe a shift from left to right of approximately 50 microns T3T2T1
 we observe a shift from left to right of approximately 50 microns T3T2T1")
14
Correction of misalignment zIterative process invoked zRotating T3 by 0.27 o flattened off all the plots (to within errors)
")
15
TPOL misalignment zThe TPOL silicon had no vertical strips zTrack through T1,T2,T3 used to predict vertical strip to fire to give indication of horizontal position of impact zNo discernable shift observed before or after T3 rotation applied zCorrection for rotations caused no discernable reduction in observed ‘width’

16
MCS, Telescope resolution and beam collimation zSimple Monte-Carlo simulation using PDG formula for MCS with gaussian width: s =(13.6MeV/ cp) (x/X o ) (1+0.038 n [x/ X o ]) zTelescope resolution and beam collimation are small factors in comparison to MCS zTogether, all these factors contribute ~102 m to the width zSubtracting in quadrature, the TPOL resolution obtained is (132 2 -102 2 ) 83 m zBut - MCS is not actually gaussian. zAttempted to use GEANT to improve estimate
![MCS, Telescope resolution and beam collimation zSimple Monte-Carlo simulation using PDG formula for MCS with gaussian width: s =(13.6MeV/ cp) (x/X o ) ( n [x/ X o ]) zTelescope resolution and beam collimation are small factors in comparison to MCS zTogether, all these factors contribute ~102 m to the width zSubtracting in quadrature, the TPOL resolution obtained is ( ) 83 m zBut - MCS is not actually gaussian.](http://images.slideplayer.com/32/9850500/slides/slide_16.jpg "zAttempted to use GEANT to improve estimate.")
17
GEANT v3.13 zGeant v3.13 used to simulate MCS through 5 surfaces zGives width of 138 m ± 1.5 zcf Observed width 132 m ± 3 zThere are other errors on this simulation, 1.5 m only statistical error. zConsistent with good performance of TPOL Silicon.

18
Error propagation zAlternative approach to Monte-Carlo zUse errors introduced by MCS etc., and propagate them to the TPOL silicon zT 4 =T 3 +Z 4 m 3 +Z 4 3 +(Z 4 -Z Al ) Al y Var(T 4 )=Var(T 3 )+Z 4 2 Var(m 3 )+Z 4 2 Var( 3 )+(Z 4 -Z Al ) 2 Var( Al )+Z 4 Cov(T3,m 3 ) zT 3 =T 1 -Z 1 m 3 -Z d d -Z 2 2 y Var(m 3 )=(1/Z 1 2 )(T 1 -T 3 -Z d d -Z 2 2 ) zVariances are calculated, (e.g. Var(T1,T2,T3)= 2 T1,T2,T3 =208 m) z T4 = [Var(T 4 )]=120 m= Error on TPOL Si due to uncertainties in Telescope zResolution of TPOL Si = [132 2 -120 2 ]=55 m T1T1 T2T2 TdTd T3T3 AlT 4 (TPOL) +z m3m3 m3m3 m3+3m3+3
= 2 T1,T2,T3 =208 m) z T4 = [Var(T 4 )]=120 m= Error on TPOL Si due to uncertainties in Telescope zResolution of TPOL Si = [ ]=55 m T1T1 T2T2 TdTd T3T3 AlT 4 (TPOL) +z m3m3 m3m3 m3+3m3+3.")
19
TPOL Resolution zObviously other effects (eg MCS) mask the resolution, so we can only say that TPOL Si results are consistent with theory. yFrom Monte-Carlo Simulation with PDG formula we obtain R TPOL 83 m yFrom Error Propagation we obtain R TPOL 55 m

20
TPOL Silicon Efficiency zTelescope used to predict TPOL events zEfficiency is the ratio of: events with TPOL Silicon signal events predicted by Telescope zTPOL Silicon edges found by looking at ratio of hits not registering in the TPOL as a function of position zLog plot reveals edges where Telescope predicts TPOL hits but TPOL does not register zHorizontal edges at 13000 & 20000 m zVertical edges at 11000 & 18000 m zConsistent with active area of Silicon Horizontal Position ( m) Vertical Position ( m) Ratio of hits NOT registering in TPOL
 Vertical Position ( m) Ratio of hits NOT registering in TPOL")
21
Efficiency cuts zUsing the edges from previous slide, we must remove predicted events from efficiency calculations where they miss the boundaries of the TPOL Si zFigures show yevents predicted by the Telescope and registered by the TPOL (black) yFor effect, events in red are added. They are predicted events which had no TPOL response, but the event was inside the opposite direction boundary, and so should have registered. zClearly, the boundaries look correct.

22
Final Efficiency zWith the positional cuts made, the efficiency of the TPOL silicon can be calculated zThis is the ratio of : events with a TPOL silicon response all predicted events inside the boundary zThe efficiency is uniform across the detector, at ~97.8%

23
Conclusions zUpgrade should improve accuracy of asymmetry measurement. zCurrently aiming for better than 1% error on P(t) yMisalignments, Coulomb Scattering and other factors contribute significantly to observed width of 132 m. yTPOL Silicon resolution TBA but preliminary studies suggest 55 and 83 m yTPOL Silicon efficiency spatially uniform at 97.8% zMore accurate knowledge of polarisation state of beam will allow ‘new physics’ to be investigated e.g.: yStandard Model: no right handed Charged Currents (W + L / W - R ). Plotting CC obs (P) allows direct measurement of right-handed W - R mass. - present limit is 720GeV set in 10/2000 by D0. Neutral Current (Z 0, ) cross sections split into 4 at high Q 2 if Leptons polarised. yThis allows measurement light quark Neutral Current couplings v u v d a u a d. (complimentary to LEP b,c quarks).
 yMisalignments, Coulomb Scattering and other factors contribute significantly to observed width of 132 m. yTPOL Silicon resolution TBA but preliminary studies suggest 55 and 83 m yTPOL Silicon efficiency spatially uniform at 97.8% zMore accurate knowledge of polarisation state of beam will allow ‘new physics’ to be investigated e.g.: yStandard Model: no right handed Charged Currents (W + L / W - R ). Plotting CC obs (P) allows direct measurement of right-handed W - R mass. - present limit is 720GeV set in 10/2000 by D0. Neutral Current (Z 0, ) cross sections split into 4 at high Q 2 if Leptons polarised. yThis allows measurement light quark Neutral Current couplings v u v d a u a d. (complimentary to LEP b,c quarks)..")
Similar presentations


>")


 Introduction Polarimetry at HERA Lessons learned from HERA Polarimetry at EIC.>")


, LEPOL Group International Workshop on Linear.>")