Download presentation
Presentation is loading. Please wait.

1
Using DataShop Tools to Model Students Learning Statistics Marsha C. Lovett Eberly Center & Psychology Acknowledgements to: Judy Brooks, Ken Koedinger, Oded Meyer, John Rinderle, Ross Strader, Candace Thille, and many others at the PSLC

2
Goal: specify knowledge components that best capture how students learn Introductory Statistics Possible Knowledge Components (KCs) What counts as a quantitative variable What graphic to use to display 2 quantitative variables How & when to compute correlation Why build, test, & refine KC models? Understand the nature of the domain Develop better instruction, e.g., cognitive tutors Others? Case Study: Introductory Statistics

3
Basic Cognitive Task Analysis (CTA) My KC modeling using DataShop Tools My applications of the KC modeling results DataShop Demo Plan for this session
 My KC modeling using DataShop Tools My applications of the KC modeling results DataShop Demo Plan for this session")
4
Identify the set of knowledge components (KCs) required for good performance in a task domain Knowledge components can be skills, facts, even metacognitive knowledge (cf. facets, production rules) Examples: Area of a circle = π r 2 To find area of a ring, subtract smaller circle’s area from larger circle’s area To find area of a frame, subtract smaller rectangle’s area from larger rectangle’s area Cognitive Task Analysis Goal: specify knowledge components that capture how students learn in the domain
 Examples: Area of a circle = π r 2 To find area of a ring, subtract smaller circle’s area from larger circle’s area To find area of a frame, subtract smaller rectangle’s area from larger rectangle’s area Cognitive Task Analysis Goal: specify knowledge components that capture how students learn in the domain.")
5
Cognitive Task Analysis (cont’d) But many knowledge decompositions are possible…
 But many knowledge decompositions are possible…")
6
As students practice a given skill, performance improves with marginally decreasing returns Students’ Learning Curves Errors Practice

7
As students practice a given skill, performance improves with marginally decreasing returns Students’ Learning Curves Errors Practice A KC-model specifies the elements being practiced and maps them to data

8
KC: how to describe a quantitative variable’s distribution Sample from Instructor Model This KC is practiced in six activities, so we organize error data for those activities

9
(cf., Lovett & Chang, 2007) Sample from Instructor Model Error data for activities corresponding to this KC do not show the predicted learning curve KC: how to describe a quantitative variable’s distribution
 Sample from Instructor Model Error data for activities corresponding to this KC do not show the predicted learning curve KC: how to describe a quantitative variable’s distribution")
10
(cf., Lovett & Chang, 2007) Same Sample from Cognitive Model Interpret histogram Interpret boxplot Interpret table
 Same Sample from Cognitive Model Interpret histogram Interpret boxplot Interpret table")
11
Organizing the data according to these KCs, we see the learning Same Sample from Cognitive Model KC’s:

12
Averaged learning curve across three KCs matches the predicted learning curve Same Sample from Cognitive Model

13
Compare two different KC models: Based on instructor’s course design Based on cognitive task analysis Compare models based on their fit to the data, using Bayesian Information Criterion (BIC) BIC = - maximized log likelihood of model under data, so lower is better (like χ 2 ) BIC penalizes for model complexity (like adjusted- R 2 ) Result preview: CTA model has better fit, even accounting for somewhat greater complexity My CTA Research with DataShop
 BIC = - maximized log likelihood of model under data, so lower is better (like χ 2 ) BIC penalizes for model complexity (like adjusted- R 2 ) Result preview: CTA model has better fit, even accounting for somewhat greater complexity My CTA Research with DataShop")
14
Some KC’s learning curves smooth, but many are not Instructor’s KC model Apply linear regression to make predictions Identify type/features of study design Describe the distribution of a single variable Identify sampling method used in a study

15
Still room for refinement, but smoother learning curves Cognitive KC Model Results Average over all KCs

16
Cognitive KC model includes splits Describe relationship btn 2 quant variables Estimate r Interpret scatterplot Instructor’s model Cognitive model

17
Cognitive KC model includes merges Check axes on graph Check axes (qual vars) Check axes (quant vars) Instructor’s model Cognitive model
 Check axes (quant vars) Instructor’s model Cognitive model")
18
Cognitive KC model revealed insufficient practice given to several KCs Identifying lurking variables Recognizing Simpson’s paradox Applying the standard deviation rule Identifying outliers Computing conditional proportions … Student performance on those KCs was poor Instructor’s KC model did not reveal these deficiencies nor were course designers/instructors aware KC model results

19
Before KC modeling, 379 activities in the course 65 new activities added to target “challenging” KC’s Learning objectives for the course revised as well: 12 learning objectives added 3 learning objectives deleted KC model results offer feedback to course designers KC modeling guides instructional design

20
Typically, instructors track students’ learning via graded activities, e.g., distribution of exam scores KC Model Offers Feedback to Instructors Implications are rather coarse Results often too late, after unit is completed KC model enables KC-specific predictions of students’ learning during a unit, in time for instructors to adjust

21
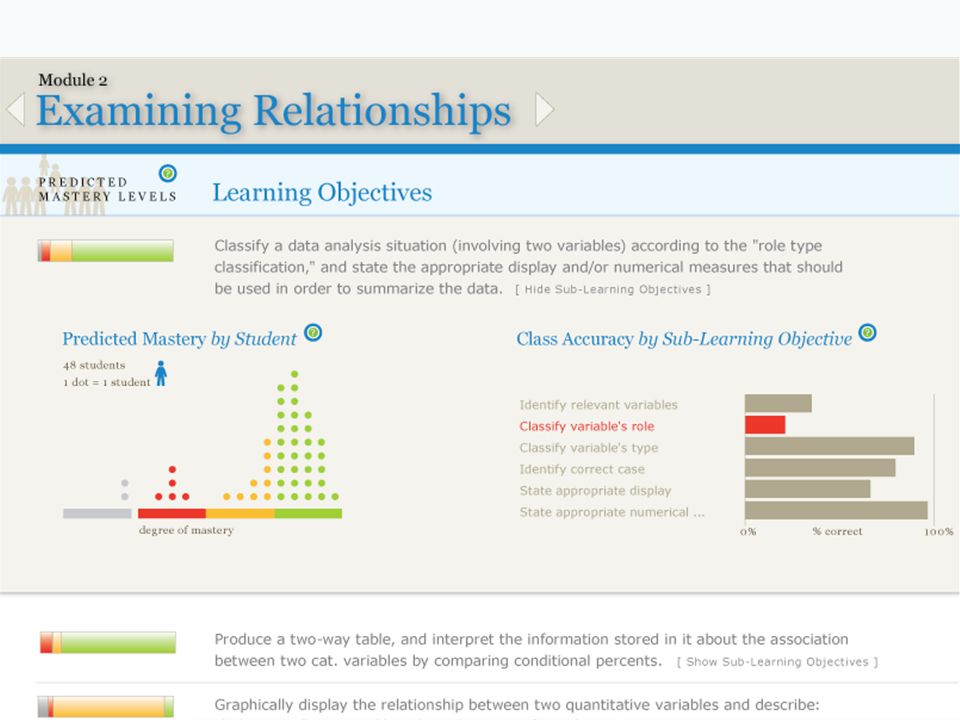
Instructor’s Digital Dashboard for Learning v 2.0

24
DataShop is at pslcdatashop.org

Similar presentations


 Bani K. Mallick1 STAT 651 Lecture #18.>")


 Ann Ooms (Kingston College, UK) Joan Garfield (Univ. of Minnesota, USA) Beth Chance (Cal Poly State Univ., USA)>")


