Download presentation
Presentation is loading. Please wait.

1
InfoGrahics Storytelling Through Visualization Graphics Eric Schiff – Marketing, Media, Communication AAD 610 – Winter ‘14

2
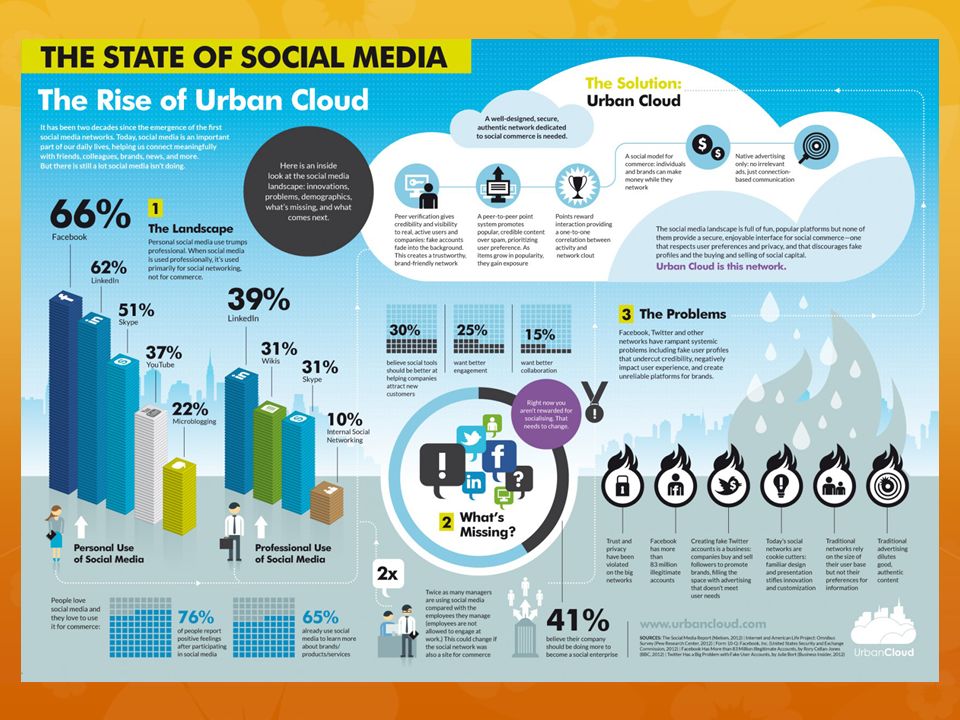
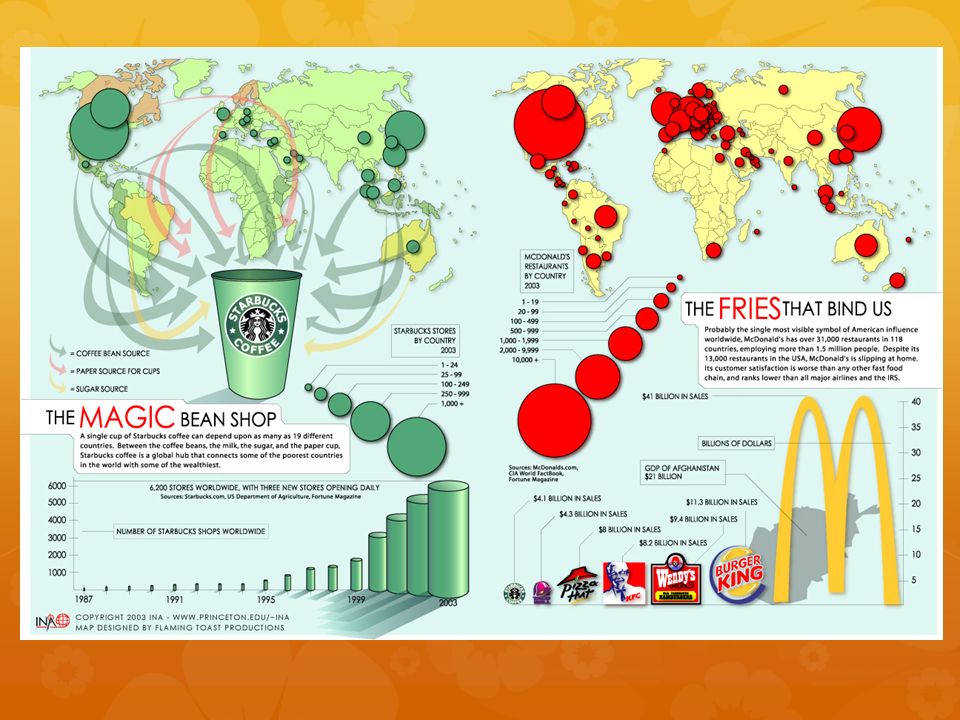
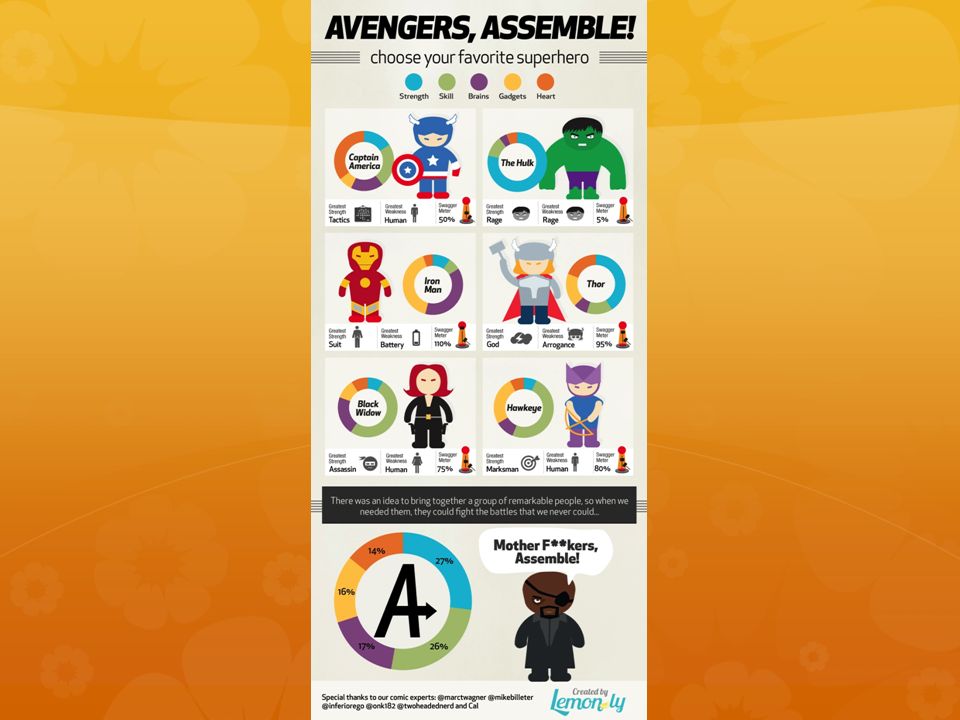
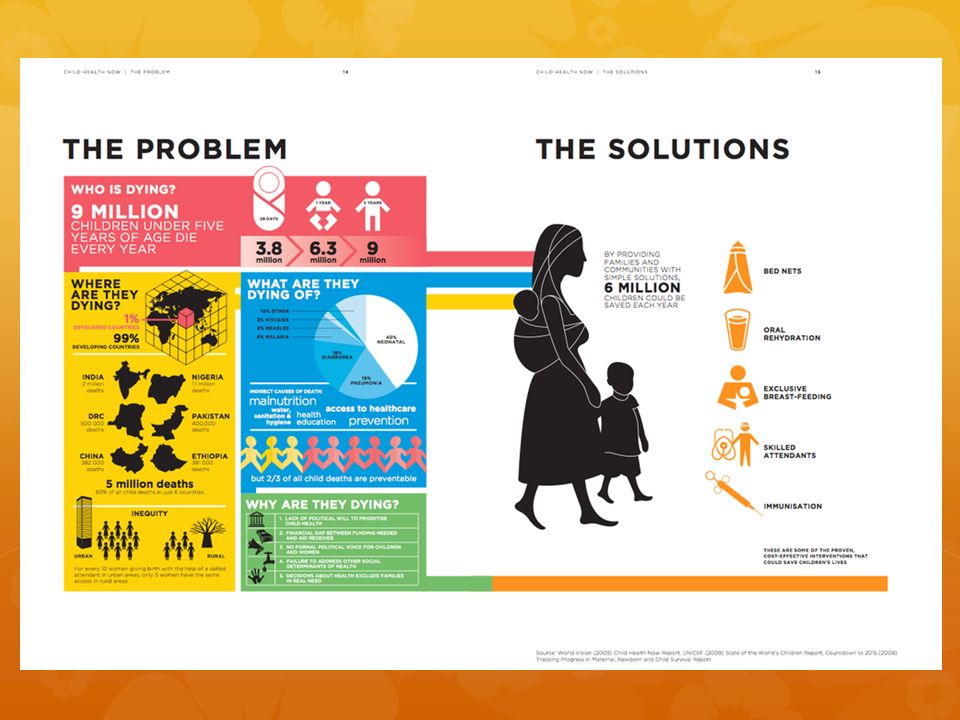
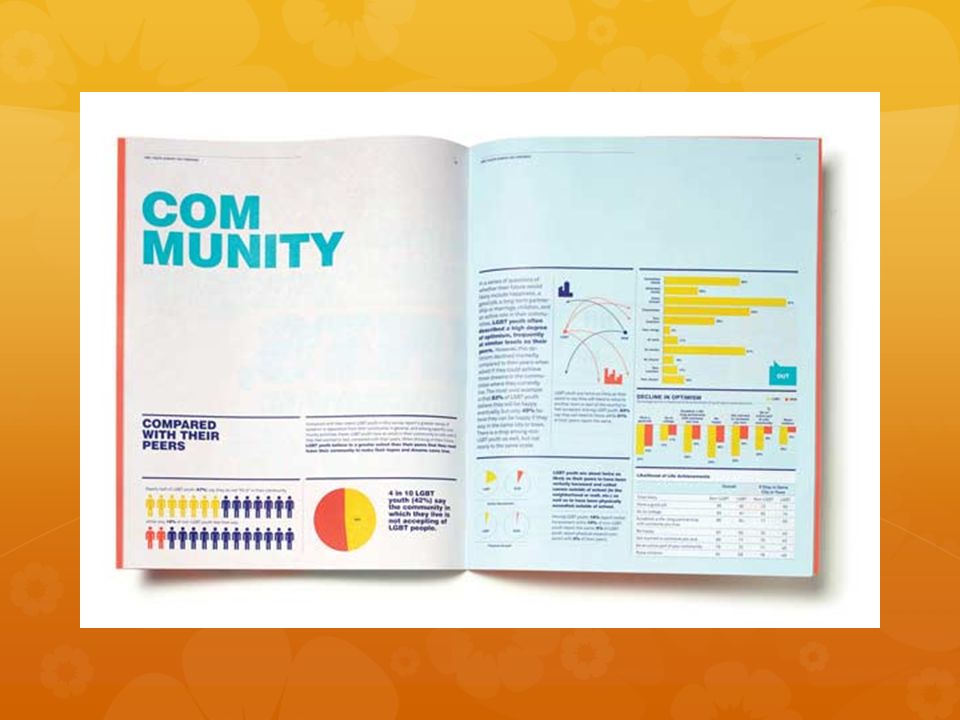
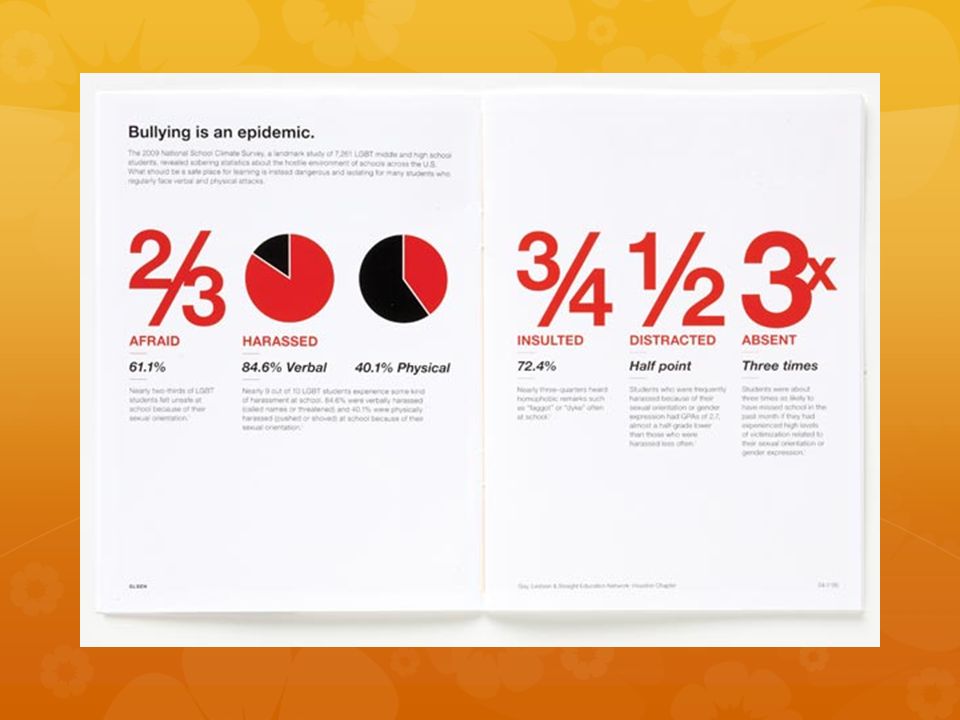
InfoGraphics Information graphics or InfoGraphics are graphic visual representations of information, data or knowledge. These graphics present complex information and analytics quickly and clearly, such as in signs, maps, journalism, financials, marketing tactics and strategies, technical writing, social and political demographics, and education. With an information graphic, computer technologists, mathematicians, social scientists, marketers, and statisticians develop and communicate concepts using symbols to process information.

3
Data Visualization Is essentially demonstrated with effectively designed InfoGraphics. InfoGraphics design requires research, and a comprehensive understanding of data to be distilled into a visual representation Successful implementation of data visualization and effective InfoGraphics requires a deliberate design approach and methodology. PLEs are an example of an InfoGraphic InfoGraphic Design Tips InfoGraphic Design Tips InfoGraphic Design Tips

4
InfoGraphic Resources There are many excellent examples of InfoGraphic design with specific genres of application found through searches on the web. Here is a link to my InfoGraphic Resources: InfoGraphics Diigo list. InfoGraphics Diigo InfoGraphics Diigo Also accessed at MktgMediaComm.com MktgMediaComm.com I’ll highlight some of those tonight.

9
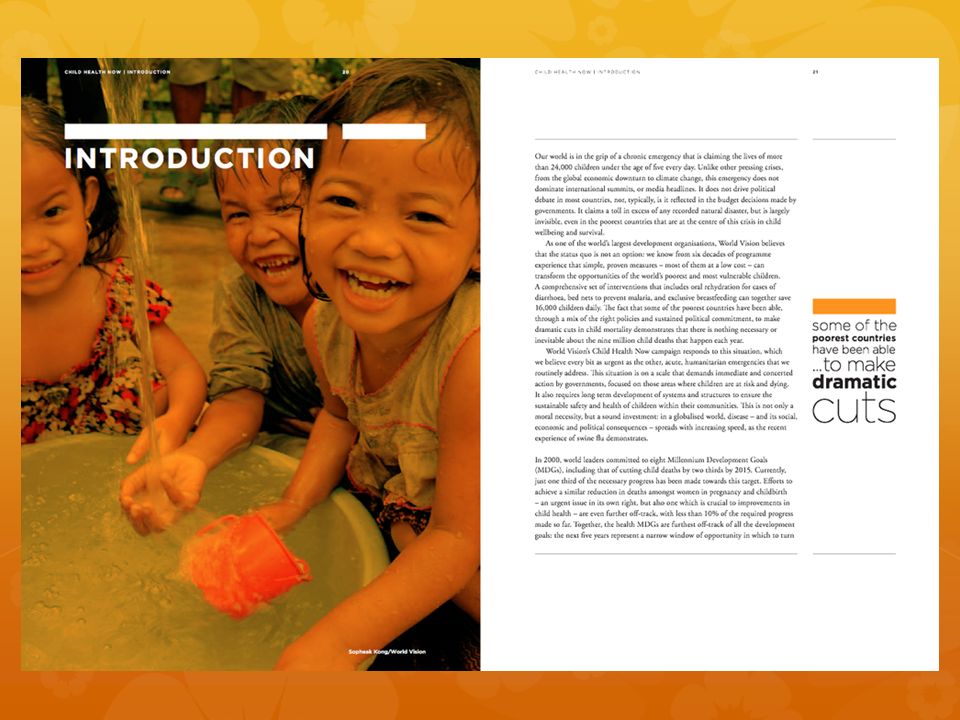
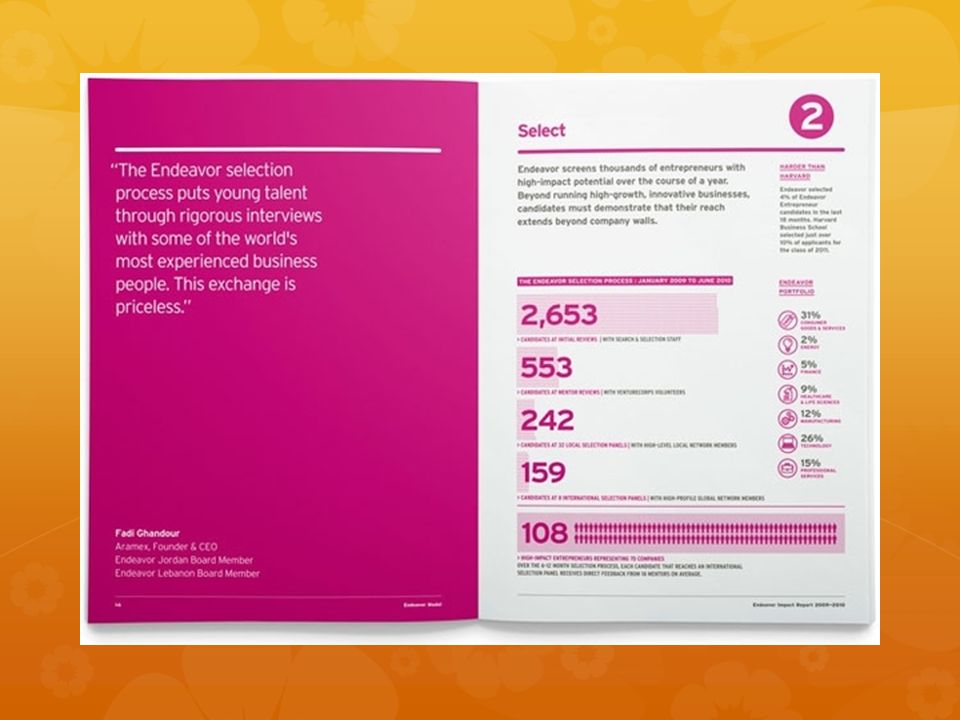
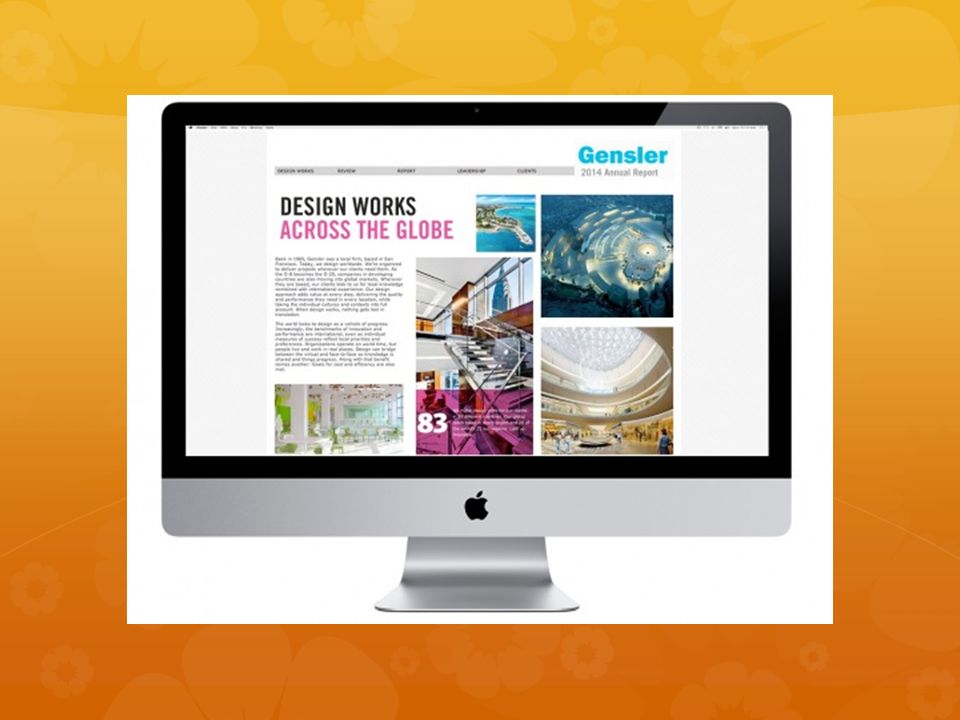
Organization Reports Print and Online – Purpose for both Brochures Quarterly Reports Annual Reports Marketing Reports Special Events and Reports

10
Report Design Different treatments for print and online Clean, clear, simple, design Intuitive organization, easy to find key information Reflect the culture of the organization Represent intent, need, and desired outcomes accurately Use well designed INFOGRAPHICS!

17
Report Design Resources There are many excellent examples of Organization Report design found through searches on the web for both non-profits and for-profit organizations Here is a link to my Org Report Resources: Org Report Diigo list. Org Report Diigo Org Report Diigo Also accessed at MktgMediaComm.com MktgMediaComm.com We’ll look at some of those tonight.

Similar presentations


 Advanced English Pablo Sherman The etymology of language.>")


