Download presentation
Presentation is loading. Please wait.

1
ANOVA I Class 13

2
Schedule for Remainder of Semester 1. ANOVA: One way, Two way 2. Planned contrasts 3. Moderated multiple regression 4. Data management 5. Survey design 6. Non-experimental designs 7. Writing up research Class assignment: After completing data analyses series.

3
ANOVA ANOVA = Analysis of Variance Next 4-5 classes focus on ANOVA One-Way ANOVA – tests differences between 2 or more independent groups. Goals for ANOVA series : 1. What is ANOVA, tasks it can do, how it works. 2. Provide intro to SPSS for Windows ANOVA 3. Objective: you will be able to run ANOVA on SPSS, and be able to interpret results. Notes on Keppel reading: 1. Clearest exposition on ANOVA 2. Assumes no math background, very intuitive 3. Language not gender neutral, more recent eds. are.

6
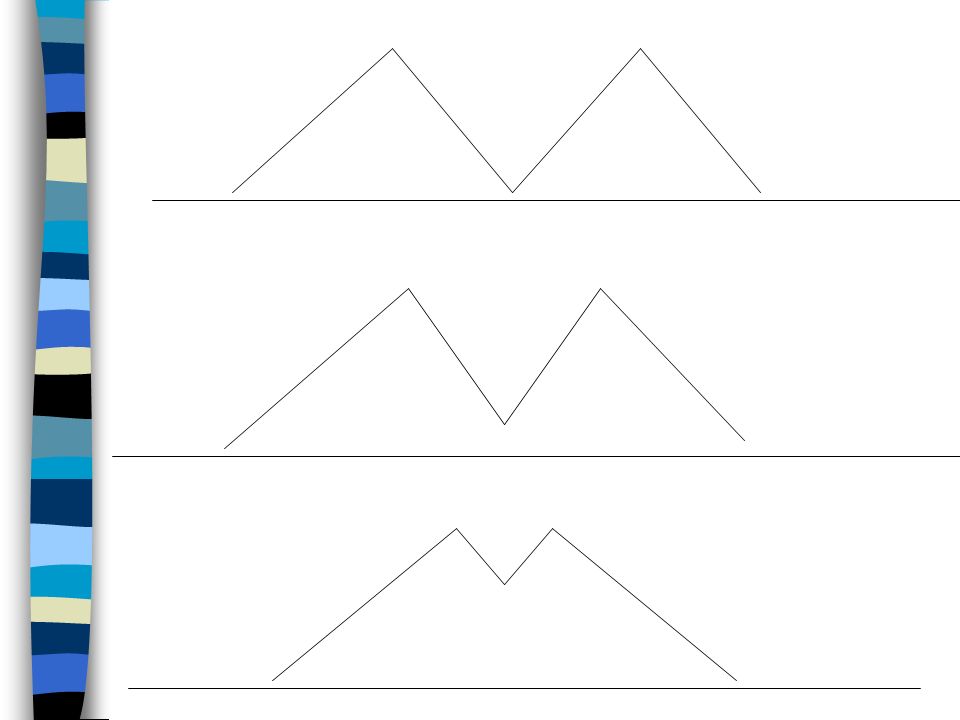
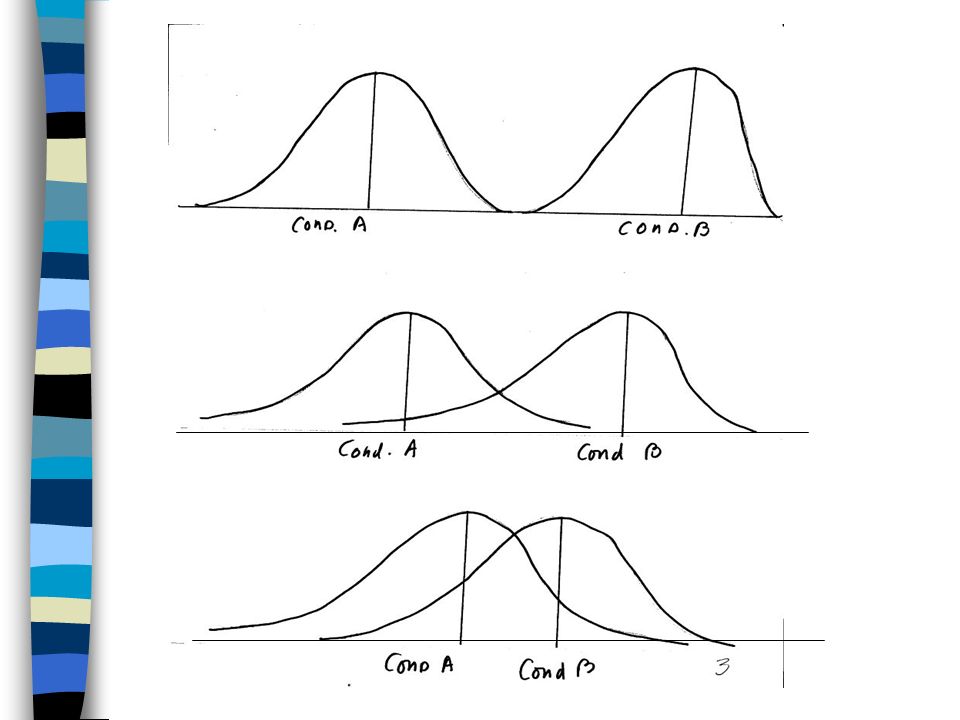
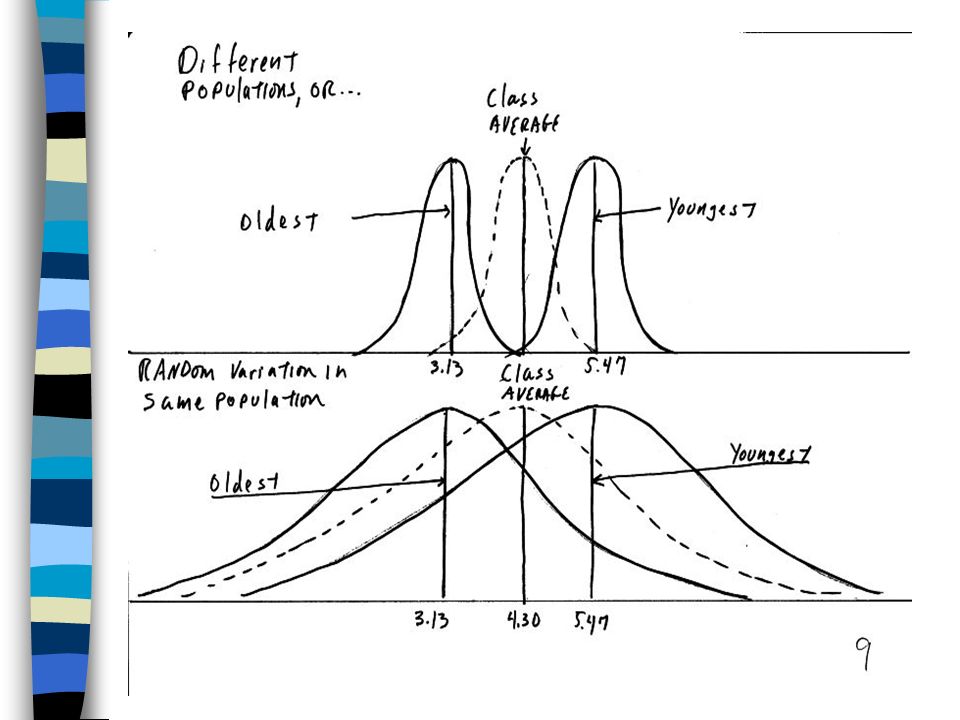
Basic Principle of ANOVA Amount Distributions Differ Amount Distributions Overlap Amount XXX Variance Amount Shared Variance Amount Groups Differ Amount Groups XXXX Same as

7
Basic Principle of ANOVA Amount Distributions Differ Amount Distributions Overlap Amount Distinct Variance Amount Shared Variance Amount Groups Differ Amount Groups Same Same as

8
Population Parameters Mean: The average score, measure, or response 2 = (X - ) 2 N S 2 = (x - X ) 2 n -1 Standard Deviation: The positive square root of the variance. 1 SD =.34 of entire distribution = (X - ) 2 N POPULATIONSAMPLE
 2 N POPULATIONSAMPLE.")
9
Population Parameters Mean: The average score, measure, or response = X N Xn Xn X = 2 = (X - ) 2 N Variance: The average amount that individual scores vary around the mean S 2 = (x - X ) 2 n -1 Standard Deviation: The positive square root of the variance. 1 SD =.34 of entire distribution = (X - ) 2 N S = ( x - X ) 2 n - 1 POPULATIONSAMPLE
 2 N S = ( x - X ) 2 n - 1 POPULATIONSAMPLE.")
10
PEOPLE WHO DISCLOSE THEIR EMOTIONS ARE: EVALUATIVE DIMENSION GoodBad Beautiful;Ugly SweetSour POTENCY DIMENSION StrongWeak LargeSmall HeavyLight ACTIVITY DIMENSION ActivePassive FastSlow HotCold

11
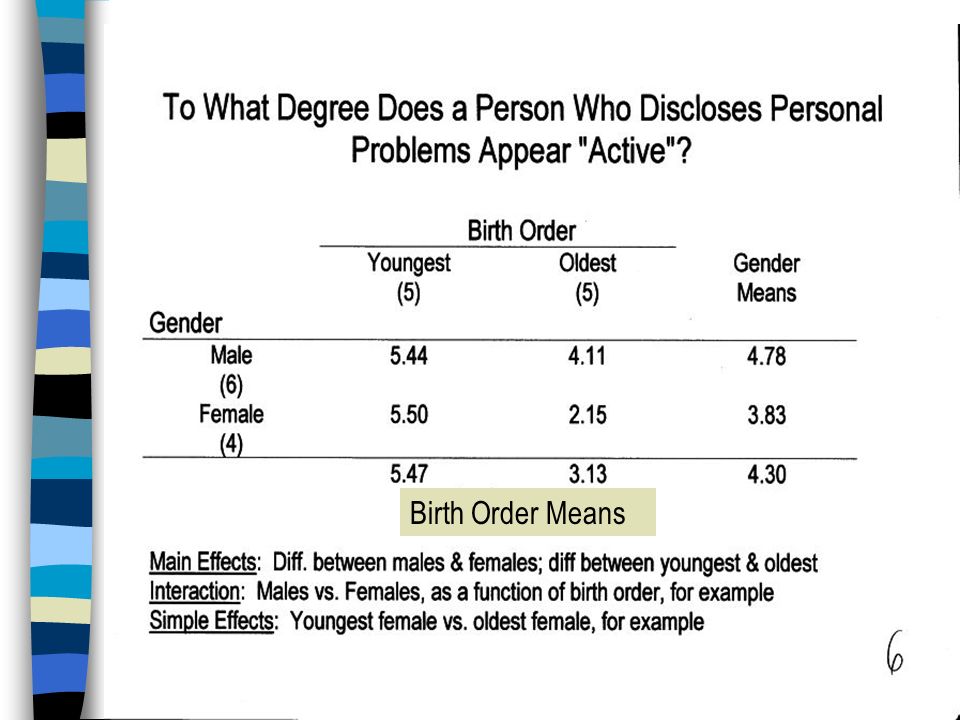
Birth Order Means

13
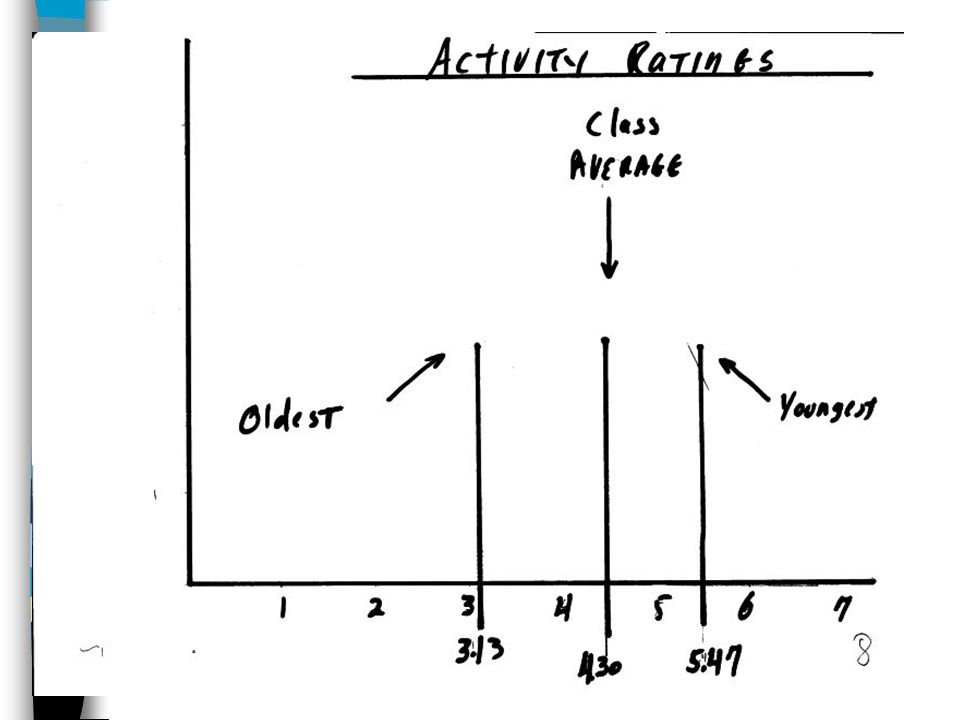
Activity Ratings as a Function of Birth Order

16
ANOVA Compares Between Group Differences to Within Group Differences Within Group Differences: Comprised of ??? Between Group Differences: Comprised of ???? ANOVA: Between Group Differences ????? When Null Hyp. is true: Between group = _XXXX Within group = YYYY When Alt Hyp. is true: Between group = XXXXX Within group = YYYY ANOVA ≤ 1 ANOVA > 1

17
ANOVA Compares Between Group Differences to Within Group Differences Within Group Differences: Comprised of random error only. Between Group Differences: Comprised of random error + treatment effects (error + true differences) ANOVA: Between Group Differences Within Group Differences When Null Hyp. is true: Between group = error Within group = error When Alt Hyp. is true: Between group = error + true diff. Within group = error ANOVA ≤ 1 ANOVA > 1
 ANOVA: Between Group Differences Within Group Differences When Null Hyp. is true: Between group = error Within group = error When Alt Hyp. is true: Between group = error + true diff. Within group = error ANOVA ≤ 1 ANOVA > 1.")
18
Logic of Inferential Statistics: Is the null hypothesis supported? Null Hypothesis: Different sub-samples are equivalent representations of same overall population. Differences between them are random. “First Born don’t differ from Last Born re. disclosers” Alternative Hypothesis Different sub-samples do not represent the same overall population. Instead represent distinct populations. Differences between them are systematic, not random. “First Born DO differ from Last Born re. disclosers ”

19
F =Differences Among Treatment Means Differences Among Subjects Treated Alike F =XXXXXX + (Experimental Error) Experimental Error F = Between-group Differences ????? Differences Logic of F Ratio

20
F =Differences Among Treatment Means Differences Among Subjects Treated Alike F =Treatment Effect + (Experimental Error) Experimental Error F = Between-group Differences Within-group Differences Logic of F Ratio
 Experimental Error F = Between-group Differences Within-group Differences Logic of F Ratio")
24
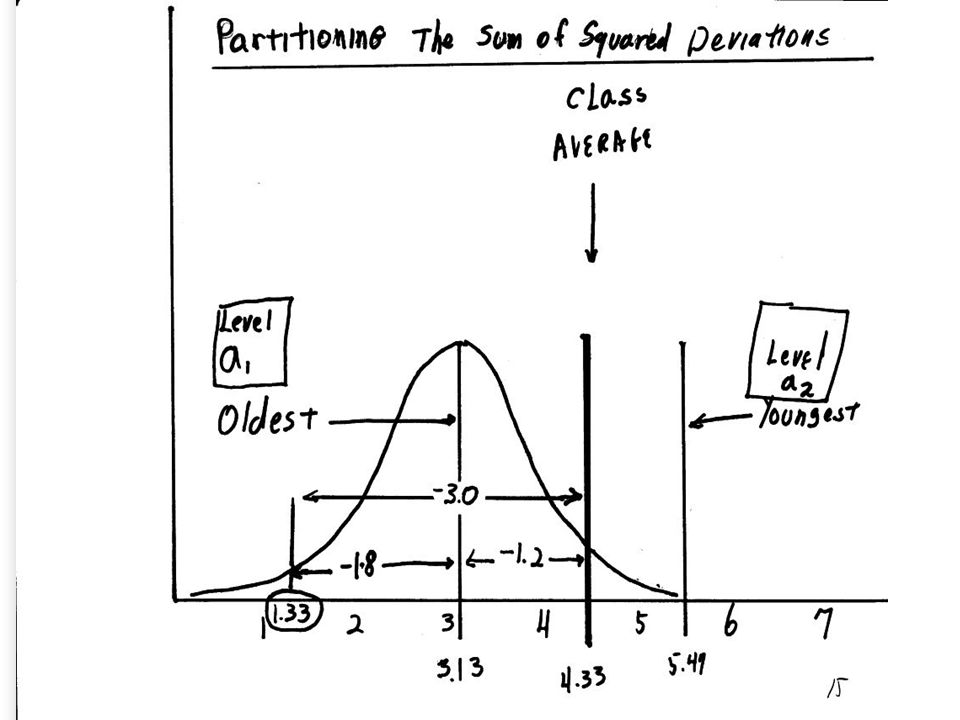
AS 1 (AS 1 - A)(AS 1 -A) 2 1.33-1.803.24 2.00-1.131.28 3.330.200.04 4.331.201.44 4.671.542.37 Average3.130.001.67 Average Scores Around the Mean “Oldest Child” AS 1 = individual scores in condition 1 (Oldest: 1.33, 2.00…) A = Mean of all scores in a condition (e.g., 3.13) (AS - A) 2 = Squared deviation between individual score and condition mean
(AS 1 -A) Average Average Scores Around the Mean Oldest Child AS 1 = individual scores in condition 1 (Oldest: 1.33, 2.00…) A = Mean of all scores in a condition (e.g., 3.13) (AS - A) 2 = Squared deviation between individual score and condition mean")
25
Sum of Squared Deviations Total Sum of Squares = Sum of Squared between-group deviations + Sum of Squared within-group deviations SS Total = SS ????? + SS ?????

26
Sum of Squared Deviations Total Sum of Squares = Sum of Squared between-group deviations + Sum of Squared within-group deviations SS Total = SS Between + SS Withinb

27
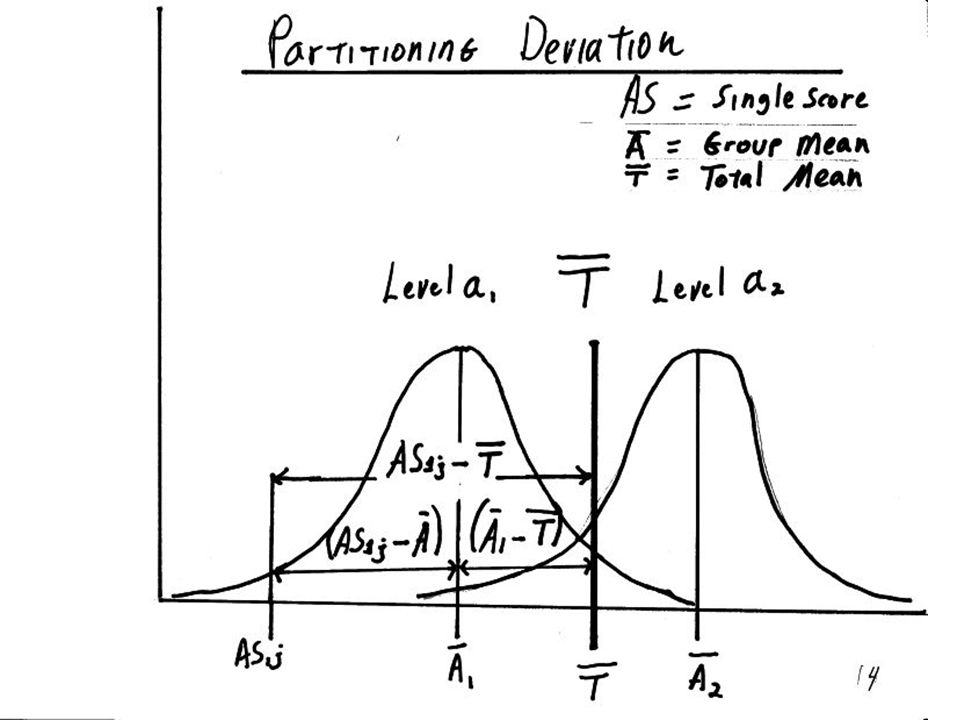
Parameter CodeFormulaSteps Total Sum of Squares SS T (AS - T) 2 1. Subtract each individual score from total mean. 2. Square each deviation. 3. Sum up all deviations, across all factor levels. Between Groups Sum of Squares SS B s [ (A - T) 2 ] 1. Subtract each group mean from the total mean. 2. Square this deviation. 3. Multiply squared deviation by number of scores in the group. 4. Repeat for each group. 5. Sum each group's squared deviation to get total. Within Groups Sum of Squares SS S/A [ (AS - A) 2 ] 1. Subtract group mean from each individual score in group. 2. Square these deviations. 3. Sum all squared deviations, within each group. 4. Sum the sums of each group's squared deviations. Computing the Sums of Squares
 2 ] 1. Subtract each group mean from the total mean. 2. Square this deviation. 3. Multiply squared deviation by number of scores in the group. 4. Repeat for each group. 5. Sum each group s squared deviation to get total. Within Groups Sum of Squares SS S/A [ (AS - A) 2 ] 1. Subtract group mean from each individual score in group. 2. Square these deviations. 3. Sum all squared deviations, within each group. 4. Sum the sums of each group s squared deviations. Computing the Sums of Squares.")
28
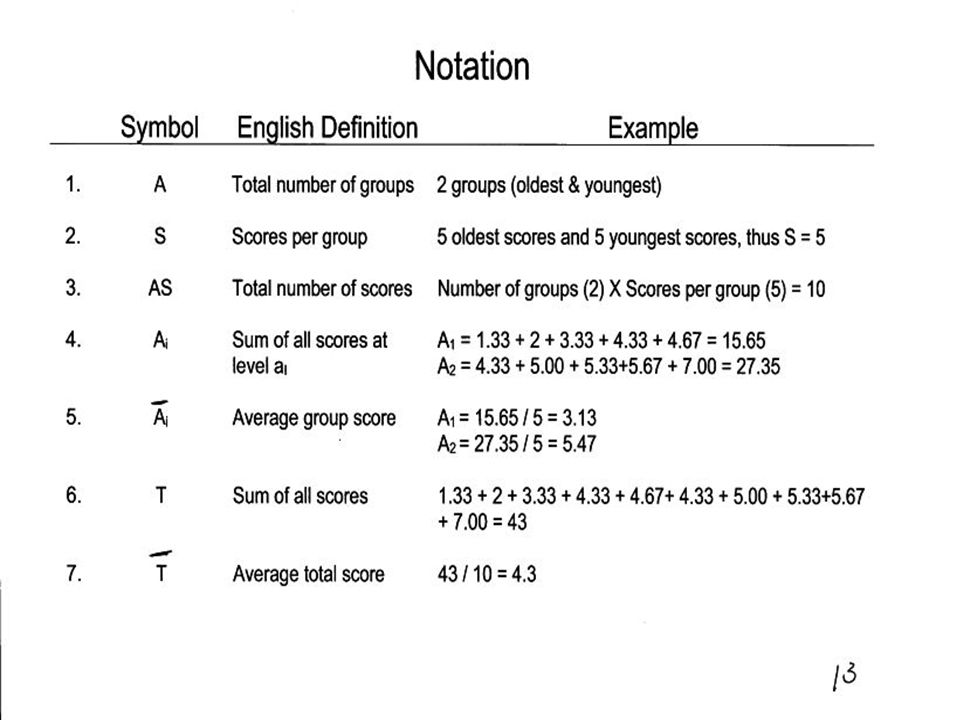
Birth Order and Ratings of “Activity” Deviation Scores AS Total Between Within (AS – T) = (A – T) +(AS –A) 1.33 (-2.97)= (-1.17) +(-1.80) 2.00(-2.30)=(-1.17) +(-1.13) 3.33(-0.97)=(-1.17) + ( 0.20) 4.33(0.03)=(-1.17) +( 1.20) 4.67(0.37)=(-1.17) + ( 1.54) Level a 1: Oldest Child Level a 2: Youngest Child 4.33 (0.03)= (1.17) +(-1.14) 5.00(0.07)= (1.17) +(-0.47) 5.33(1.03)= (1.17) + (-0.14) 5.67(1.37)= (1.17) +( 0.20) 7.00(2.70)= (1.17) + ( 1.53) Sum: (0) = (0) + (0) Mean scores: Oldest = 3.13Youngest = 5.47 Total = 4.30
 = (A – T) +(AS –A) 1.33 (-2.97)= (-1.17) +(-1.80) 2.00(-2.30)=(-1.17) +(-1.13) 3.33(-0.97)=(-1.17) + ( 0.20) 4.33(0.03)=(-1.17) +( 1.20) 4.67(0.37)=(-1.17) + ( 1.54) Level a 1: Oldest Child Level a 2: Youngest Child 4.33 (0.03)= (1.17) +(-1.14) 5.00(0.07)= (1.17) +(-0.47) 5.33(1.03)= (1.17) + (-0.14) 5.67(1.37)= (1.17) +( 0.20) 7.00(2.70)= (1.17) + ( 1.53) Sum: (0) = (0) + (0) Mean scores: Oldest = 3.13Youngest = 5.47 Total = 4.30")
29
Computing Sums of Squares from Deviation Scores Birth Order and Activity Ratings (continued) SS = Sum of squared diffs, AKA “sum of squares” SS T =Sum of squares., total (all subjects) SS A = Sum of squares, between groups (treatment) SS s/A =Sum of squares, within groups (error) SS T = (-2.97) 2 + (-2.30) 2 + … + (1.37) 2 + (2.70) 2 = 25.88 SS A = (-1.17) 2 + (-1.17) 2 + … + (1.17) 2 + (1.17) 2 = 13.61 SS s/A = (-1.80) 2 + (-1.13) 2 + … + (0.20) 2 + (1.53) 2 = 12.27 Total (SS A + SS s/A ) = 25.88
 SS = Sum of squared diffs, AKA sum of squares SS T =Sum of squares., total (all subjects) SS A = Sum of squares, between groups (treatment) SS s/A =Sum of squares, within groups (error) SS T = (-2.97) 2 + (-2.30) 2 + … + (1.37) 2 + (2.70) 2 = SS A = (-1.17) 2 + (-1.17) 2 + … + (1.17) 2 + (1.17) 2 = SS s/A = (-1.80) 2 + (-1.13) 2 + … + (0.20) 2 + (1.53) 2 = Total (SS A + SS s/A ) = 25.88")
30
Logic of F Test and Hypothesis Testing Form of F Test: Between Group Differences Within Group Differences Purpose: Test null hypothesis: Between Group = XXXX = YYYY Interpretation: If null hypothesis is not supported (F > 1) then Between Group diffs are not simply random error, but instead reflect ??????. Result: Null hypothesis is rejected, alt. hypothesis is therefore ___ PROVED ___ SUPPORTED

31
Logic of F Test and Hypothesis Testing Form of F Test: Between Group Differences Within Group Differences Purpose: Test null hypothesis: Between Group = Within Group = Random Error Interpretation: If null hypothesis is not supported (F > 1) then Between Group diffs are not simply random error, but instead reflect effect of the independent variable. Result: Null hypothesis is rejected, alt. hypothesis is supported (BUT NOT PROVED!)
.")
Similar presentations


: the two.>")
 when.>")


>")
