Download presentation
Presentation is loading. Please wait.

1
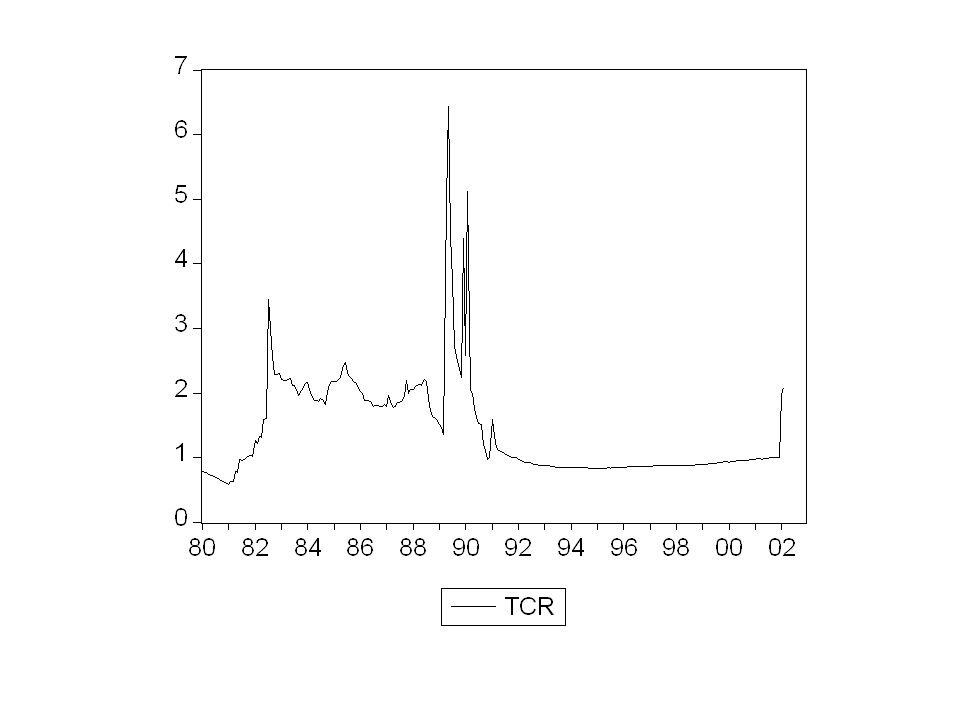
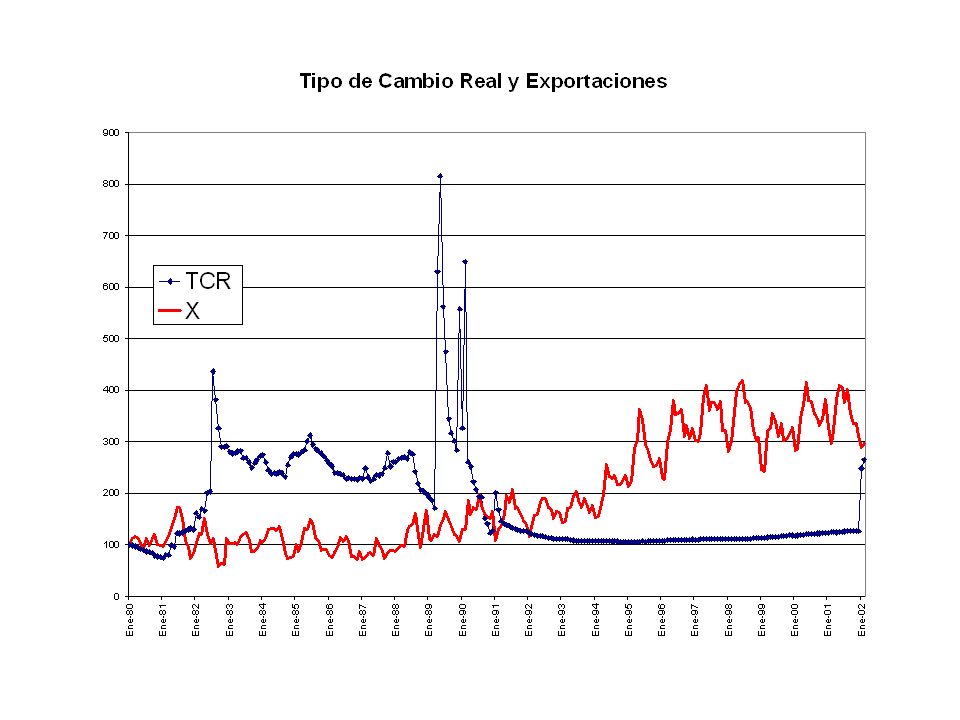
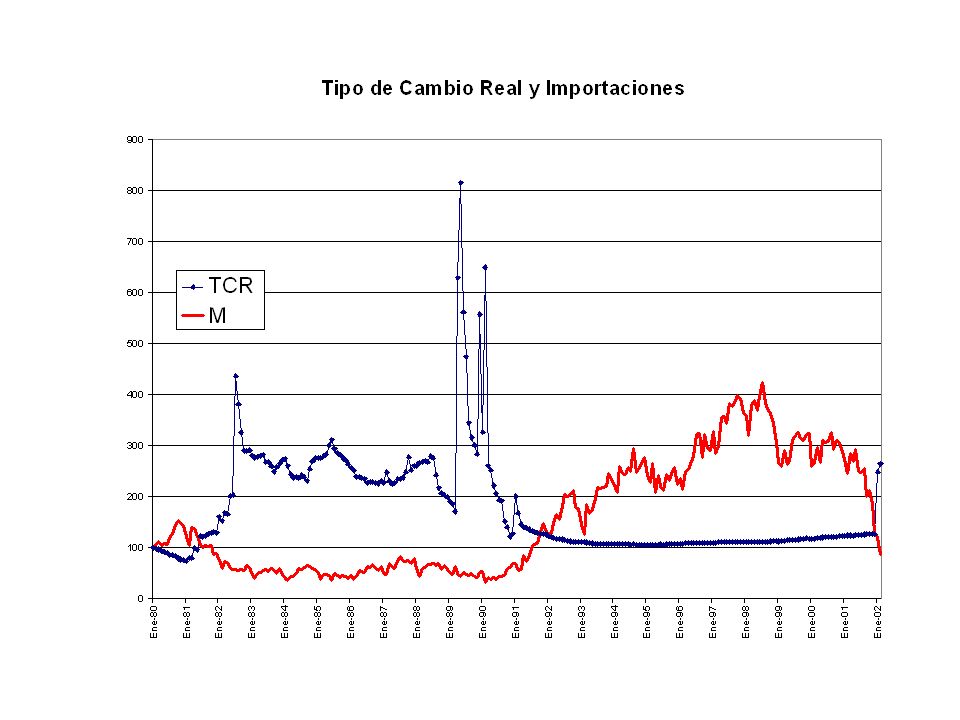
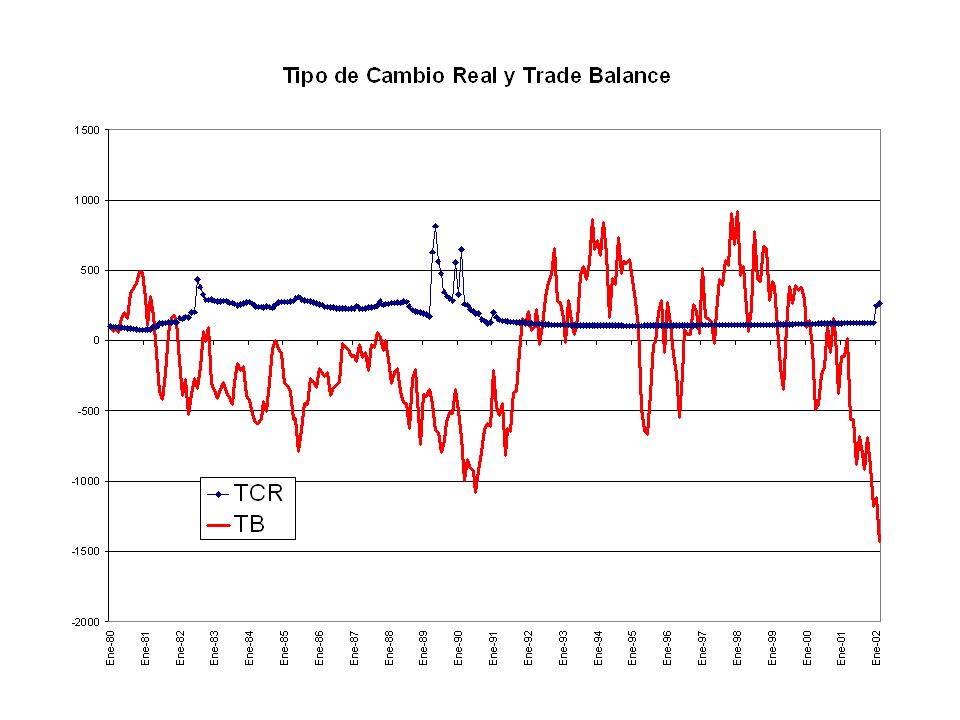
Partial Equilibrium Framework Empirical Evidence for Argentina (1980-2002)
")
6
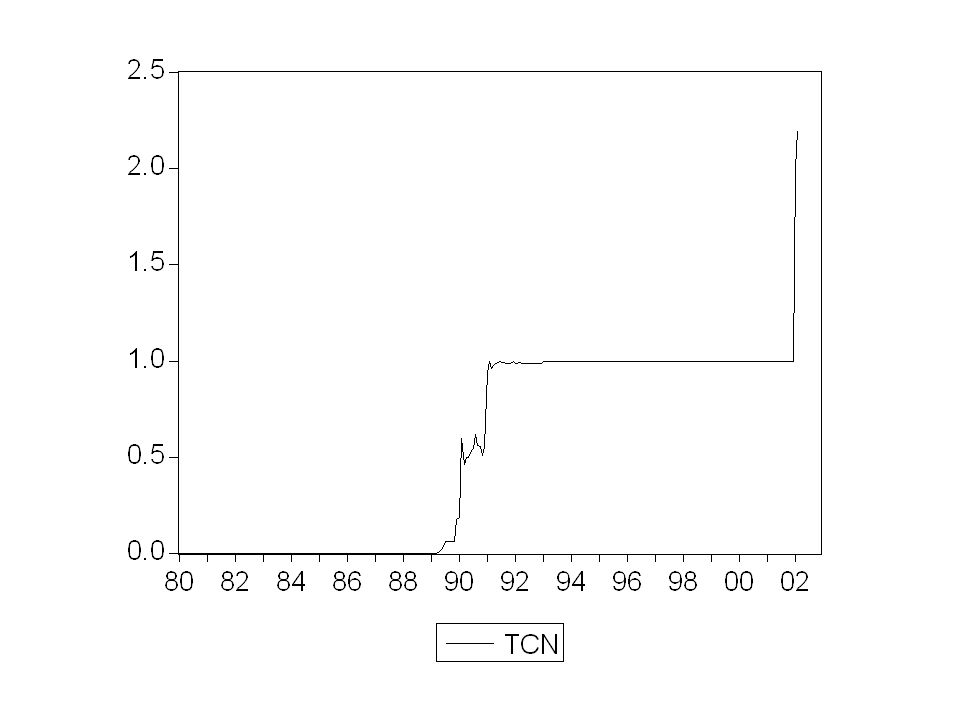
Dependent Variable: CRECX Method: Least Squares Date: 04/24/02 Time: 18:25 Sample(adjusted): 1980:02 2002:02 Included observations: 265 after adjusting endpoints VariableCoefficientStd. Errort-StatisticProb. CRECTCN0.0014620.0254740.0574090.9543 C0.0133250.0089971.4809910.1398 R-squared0.000013 Mean dependent var0.013468 Adjusted R-squared-0.003790 S.D. dependent var0.140447 S.E. of regression0.140713 Akaike info criterion-1.076668 Sum squared resid5.207450 Schwarz criterion-1.049651 Log likelihood144.6585 F-statistic0.003296 Durbin-Watson stat2.019952 Prob(F-statistic)0.954263 Dependent Variable: CRECTB Method: Least Squares Date: 04/24/02 Time: 18:30 Sample(adjusted): 1980:02 2002:02 Included observations: 265 after adjusting endpoints VariableCoefficientStd. Errort-StatisticProb. CRECTCN0.1389481.0028220.1385570.8899 C-0.8117810.354200-2.2918720.0227 R-squared0.000073 Mean dependent var-0.798160 Adjusted R-squared-0.003729 S.D. dependent var5.529132 S.E. of regression5.539432 Akaike info criterion6.269180 Sum squared resid8070.236 Schwarz criterion6.296196 Log likelihood-828.6663 F-statistic0.019198 Durbin-Watson stat1.993912 Prob(F-statistic)0.889906
 Dependent Variable: CRECTB Method: Least Squares Date: 04/24/02 Time: 18:30 Sample(adjusted): 1980: :02 Included observations: 265 after adjusting endpoints VariableCoefficientStd. Errort-StatisticProb. CRECTCN C R-squared Mean dependent var Adjusted R-squared S.D. dependent var S.E. of regression Akaike info criterion Sum squared resid Schwarz criterion Log likelihood F-statistic Durbin-Watson stat Prob(F-statistic)")
7
Dependent Variable: CRECX Method: Least Squares Date: 04/24/02 Time: 18:33 Sample(adjusted): 1980:02 2002:02 Included observations: 265 after adjusting endpoints VariableCoefficientStd. Errort-StatisticProb. CRECTCR-0.0405230.039024-1.0384200.3000 C0.0141740.0086531.6380770.1026 R-squared0.004083 Mean dependent var0.013468 Adjusted R-squared0.000297 S.D. dependent var0.140447 S.E. of regression0.140426 Akaike info criterion-1.080747 Sum squared resid5.186251 Schwarz criterion-1.053731 Log likelihood145.1990 F-statistic1.078316 Durbin-Watson stat1.995491 Prob(F-statistic)0.300028 Dependent Variable: CRECTB Method: Least Squares Date: 04/24/02 Time: 18:36 Sample(adjusted): 1980:02 2002:02 Included observations: 265 after adjusting endpoints VariableCoefficientStd. Errort-StatisticProb. CRECTCR0.0428291.5394270.0278210.9778 C-0.7989060.341352-2.3404210.0200 R-squared0.000003 Mean dependent var-0.798160 Adjusted R-squared-0.003799 S.D. dependent var5.529132 S.E. of regression5.539626 Akaike info criterion6.269250 Sum squared resid8070.801 Schwarz criterion6.296266 Log likelihood-828.6756 F-statistic0.000774 Durbin-Watson stat1.993844 Prob(F-statistic)0.977826
 Dependent Variable: CRECTB Method: Least Squares Date: 04/24/02 Time: 18:36 Sample(adjusted): 1980: :02 Included observations: 265 after adjusting endpoints VariableCoefficientStd. Errort-StatisticProb. CRECTCR C R-squared Mean dependent var Adjusted R-squared S.D. dependent var S.E. of regression Akaike info criterion Sum squared resid Schwarz criterion Log likelihood F-statistic Durbin-Watson stat Prob(F-statistic)")
8
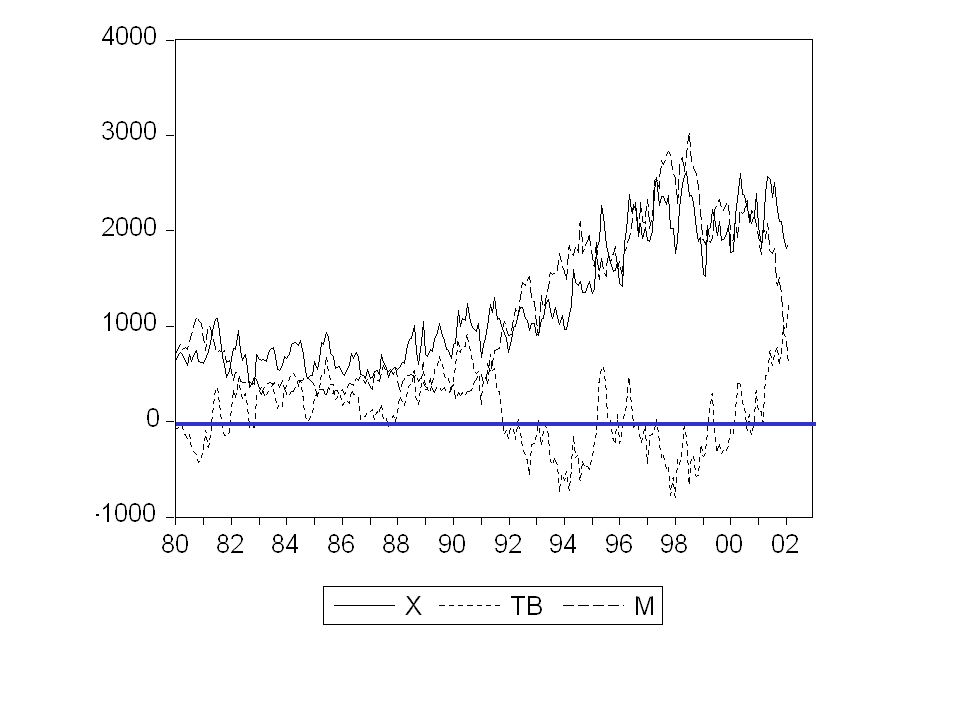
Dependent Variable: HPX Method: Least Squares Date: 04/24/02 Time: 18:40 Sample(adjusted): 1980:01 2002:02 Included observations: 266 after adjusting endpoints VariableCoefficientStd. Errort-StatisticProb. TCR-383.674341.54170-9.2358850.0000 C1757.02366.8491126.283420.0000 R-squared0.244206 Mean dependent var1219.080 Adjusted R-squared0.241343 S.D. dependent var614.3172 S.E. of regression535.0759 Akaike info criterion15.41018 Sum squared resid75584835 Schwarz criterion15.43713 Log likelihood-2047.555 F-statistic85.30157 Durbin-Watson stat0.099334 Prob(F-statistic)0.000000 Dependent Variable: HPTB Method: Least Squares Date: 04/24/02 Time: 18:48 Sample(adjusted): 1980:01 2002:02 Included observations: 266 after adjusting endpoints VariableCoefficientStd. Errort-StatisticProb. TCR209.297716.8220512.441860.0000 C-210.239227.07013-7.7664650.0000 R-squared0.369627 Mean dependent var83.21327 Adjusted R-squared0.367240 S.D. dependent var272.3896 S.E. of regression216.6756 Akaike info criterion13.60217 Sum squared resid12394360 Schwarz criterion13.62911 Log likelihood-1807.089 F-statistic154.8000 Durbin-Watson stat0.181556 Prob(F-statistic)0.000000
 Dependent Variable: HPTB Method: Least Squares Date: 04/24/02 Time: 18:48 Sample(adjusted): 1980: :02 Included observations: 266 after adjusting endpoints VariableCoefficientStd. Errort-StatisticProb. TCR C R-squared Mean dependent var Adjusted R-squared S.D. dependent var S.E. of regression Akaike info criterion Sum squared resid Schwarz criterion Log likelihood F-statistic Durbin-Watson stat Prob(F-statistic)")
9
Dependent Variable: HPM Method: Least Squares Date: 04/23/03 Time: 17:12 Sample(adjusted): 1980:01 2002:02 Included observations: 266 after adjusting endpoints VariableCoefficientStd. Errort-StatisticProb. C1967.26375.1573926.175240.0000 TCR-592.972046.70467-12.696200.0000 R-squared0.379106 Mean dependent var1135.867 Adjusted R-squared0.376754 S.D. dependent var762.0121 S.E. of regression601.5773 Akaike info criterion15.64448 Sum squared resid95540345 Schwarz criterion15.67142 Log likelihood-2078.716 F-statistic161.1936 Durbin-Watson stat0.186776 Prob(F-statistic)0.000000
")
Similar presentations


 White noise input output Random walkSynthesis 1/(1 – bz) White noise input output.>")

