Download presentation
Presentation is loading. Please wait.

1
HSA, Dropouts, Graduation and AYP Report to the Board of Education October 25, 2011

2
HIGH SCHOOL ASSESSMENTS

3
Class of 2011 How they met requirements Special Education Certificates Special Education Certificates Passed all four Passed all four Combined score Combined score Bridge Bridge Waiver Waiver

4
Class of 2011 How they met requirements SpEd Certificates - 722 Graduates Entering Prior to 2005 - 226 CompletersNon-Completers Passed 4 -42,938 Combined Score – 9360 Bridge - 5350 Waiver - 133 Not Met-HSA Only 0 Not Met-Other 3063 Dropouts 1821 Total Completers - 59,377 Total - 4220 June 2011 63,605 Sept. 2010 60,555 Enrollment Non-Grads without HSA requirement - 1157 Total Diplomas - 58,753

5
Non-Grads: A Closer Look Total Non-Grads: 4220 Working toward Special Ed Certificates: 1103 Working toward Special Ed Certificates: 1103 Entered prior to 2005 (no HSA requirement): 54 Entered prior to 2005 (no HSA requirement): 54 Breakdown for Non-Grads Responsible for HSA Requirement
: 54 Entered prior to 2005 (no HSA requirement): 54 Breakdown for Non-Grads Responsible for HSA Requirement")
6
Who Dropped Out During Senior Year? Group20102011 NumberRateNumberRate All Students 13862.1%18212.7% ELL 373.5%485.1% Special Ed 2343.4%3144.5% FARMs 4142.3%5703.1%

7
Class of 2009 thru 2011 How they met requirements

8
Class of 2011 Subgroups How they met requirements

9
Class of 2011 Services Groups How they met requirements

10
Class of 2011: 133 Waivers 200920102011

11
Waivers by Subgroup

12
First Time Taker Pass Rates

13
First Time Pass Rate Data by Subgroup - 2011

14
First Time Pass Rate Data by Services Group - 2011

15
Changes for 2012 Elimination of government requirement Elimination of government requirement New combined score is 1208 New combined score is 1208 Students who took government previously can use their score to help them meet requirements. Students who took government previously can use their score to help them meet requirements.

16
Graduation

17
Graduation Rate “Leaver Rate” No longer used for accountability No longer used for accountability Counts all graduates, not just those who graduate in 4 years Counts all graduates, not just those who graduate in 4 years Does not follow a Grade 9 cohort Does not follow a Grade 9 cohort Only measure with trends Only measure with trends

18
Graduation Rate Trend (Leaver)
")
19
Changes for 2011 Implementation of cohort graduation rate for AYP Implementation of cohort graduation rate for AYP “On-time” graduates “On-time” graduates Report 4 and 5-year rate for each cohort Report 4 and 5-year rate for each cohort Requires “lagged” rate (using Class of 2010) Requires “lagged” rate (using Class of 2010)
 Requires lagged rate (using Class of 2010)")
20
20 Definition : Four-Year Adjusted Cohort Rate The number of students who graduate in four years with a regular high school diploma divided by the number of students who form the adjusted cohort for that graduating class. Follows a cohort, or a group of students, who begin as first-time ninth graders in a particular school year.Follows a cohort, or a group of students, who begin as first-time ninth graders in a particular school year. For high schools that start after grade nine, the cohort is calculated based on the earliest high school grade.For high schools that start after grade nine, the cohort is calculated based on the earliest high school grade.

21
Cohort Graduation Rate Data

22
2010 Cohort Graduation Rate Data by Subgroup

23
2010 Cohort Graduation Rate Data by Services Group

24
Dropouts

25
Dropouts-Event Rate Trend

26
Difference Between Current and Cohort Drop Out Rates Annual Event Rate Does not require an LDS (1 year of data) Does not require an LDS (1 year of data) Reflects all drop outs across grades 9-12 in a given school year Reflects all drop outs across grades 9-12 in a given school year Reports every “event” of drop out: students can be counted twice Reports every “event” of drop out: students can be counted twice A drop out can also count as a graduate A drop out can also count as a graduate Adjusted Cohort Rate Requires an LDS (4 years of data) Requires an LDS (4 years of data) Reflects cumulative drop outs across a 4 and 5 – year period from a cohort group entering Grade 9 at the same time Reflects cumulative drop outs across a 4 and 5 – year period from a cohort group entering Grade 9 at the same time Students are only counted once (final status) Students are only counted once (final status)
 Does not require an LDS (1 year of data) Reflects all drop outs across grades 9-12 in a given school year Reflects all drop outs across grades 9-12 in a given school year Reports every event of drop out: students can be counted twice Reports every event of drop out: students can be counted twice A drop out can also count as a graduate A drop out can also count as a graduate Adjusted Cohort Rate Requires an LDS (4 years of data) Requires an LDS (4 years of data) Reflects cumulative drop outs across a 4 and 5 – year period from a cohort group entering Grade 9 at the same time Reflects cumulative drop outs across a 4 and 5 – year period from a cohort group entering Grade 9 at the same time Students are only counted once (final status) Students are only counted once (final status)")
27
Other New Features Cohort drop out rate includes as drop outs Cohort drop out rate includes as drop outs –Students who do not continue from the end of one school year to the beginning of the next (cross summer) –Any student classified as a transfer who cannot be verified as enrolled somewhere else –Non-graduates at the end of Year 4 who do not re-enroll in Year 5.
 –Any student classified as a transfer who cannot be verified as enrolled somewhere else –Non-graduates at the end of Year 4 who do not re-enroll in Year 5.")
28
Cohort Drop Out Rate Data

29
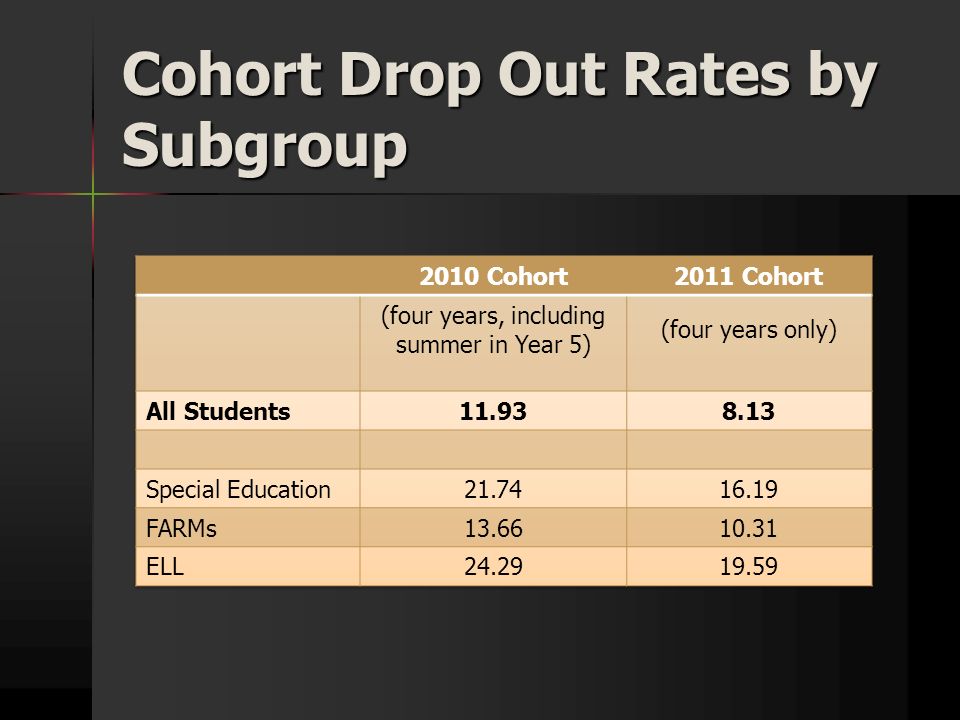
Cohort Drop Out Rates by Subgroup

31
2011 High School Adequate Yearly Progress

32
What is “AYP” Adequate Yearly Progress – sufficient progress toward the goal of 100% proficient by 2014 Adequate Yearly Progress – sufficient progress toward the goal of 100% proficient by 2014 Determination of school success based on No Child Left Behind Determination of school success based on No Child Left Behind Uses MSA results and graduation rate Uses MSA results and graduation rate Schools must meet a yearly target (AMO) Schools must meet a yearly target (AMO) Must meet target for each of 10 subgroups Must meet target for each of 10 subgroups
 Schools must meet a yearly target (AMO) Must meet target for each of 10 subgroups Must meet target for each of 10 subgroups")
33
AYP “Cells” Chart Group ReadingMathematics Graduation % ProficientParticipation% ProficientParticipation All Students Hispanic Amer. Ind. Asian African Amer. Hawaiian White 2 or More FARMs ELL Special Ed.

34
Challenges to Achieving AYP Target rises each year: Target rises each year: AMOs

35
Challenges to Achieving AYP (cont.) Confidence interval shrinks each year Confidence interval shrinks each year All subgroups must achieve targets All subgroups must achieve targets –Subgroups with 5 students or more counted –This year we have 10 subgroups instead of the 8 we have had in the past Students receiving special services Students receiving special services USDE projected in March that 80 percent of schools would fail to make AYP USDE projected in March that 80 percent of schools would fail to make AYP
 Confidence interval shrinks each year Confidence interval shrinks each year All subgroups must achieve targets All subgroups must achieve targets –Subgroups with 5 students or more counted –This year we have 10 subgroups instead of the 8 we have had in the past Students receiving special services Students receiving special services USDE projected in March that 80 percent of schools would fail to make AYP USDE projected in March that 80 percent of schools would fail to make AYP")
36
School Improvement Categories STAGESPATHWAYS ComprehensiveNeedsPathwayFocusedNeedsPathway DevelopingStageFailing: -All students or -3+ subgroups Failing: -1 to 2 subgroups PriorityStage

37
School Improvement Categories STAGESPATHWAYS Comprehensive Needs PathwayFocusedNeedsPathway DevelopingStage Schools enter after not achieving AYP two times PriorityStage Schools enter when AYP failed fifth time

38
High Schools in Improvement STAGESPATHWAYS Comprehensive Needs PathwayFocusedNeedsPathway DevelopingStage 2009: 7 schools 2010: 5 schools 2011: 37 schools 2011: 37 schools 2009: 8 schools 2010: 5 schools 2011: 19 schools 2011: 19 schools PriorityStage 2009: 13 schools 2010: 19 schools 2011: 21 schools 2009: 15 schools 2010: 5 schools 2011: 2 schools

39
AYP Results- 2011 High Schools 3 schools exited school improvement 3 schools exited school improvement 79 schools are in school improvement 79 schools are in school improvement –41 more than in 2010 44 schools missed AYP for the first time 44 schools missed AYP for the first time Special education subgroups account for 39 percent of schools not meeting AYP because of only one subgroup. Special education subgroups account for 39 percent of schools not meeting AYP because of only one subgroup.

40
Schools in Improvement All Schools STAGESPATHWAYS Comprehensive Needs PathwayFocusedNeedsPathway DevelopingStage 2009: 47 schools 2010: 85 schools 2011: 179 schools 2009: 45 schools 2010: 27 schools 2011: 45 schools PriorityStage 2009: 85 schools 2010: 85 schools 2011: 96 schools 2009: 23 schools 2009: 23 schools 2010: 7 schools 2011: 6 schools

41
AYP Breakdown – 2011 All Schools AYP CategoryNumber Percent * Met AYP 76055.2 In School Improvement 141.0 Exit School Improvement 110.8 Not Met AYP 61644.8 Local Attention 29921.7 School Improvement 32623.7 Total 1376 * Percentage is of total number of schools

42
AYP Results- 2011 All Schools Of 1376 schools, 760 (55%) met AYP Of 1376 schools, 760 (55%) met AYP 11 schools exited school improvement 11 schools exited school improvement 123 more schools are in school improvement now than in 2010 123 more schools are in school improvement now than in 2010
 met AYP Of 1376 schools, 760 (55%) met AYP 11 schools exited school improvement 11 schools exited school improvement 123 more schools are in school improvement now than in more schools are in school improvement now than in 2010")
43
HSA and Graduation Questions and Discussion

Similar presentations


 Report 2010-2011 Presented to ACISD Board of Trustees 12/15/2011 ARANSAS COUNTY ISD – A TEA RECOGNIZED SCHOOL.>")


