Download presentation
Presentation is loading. Please wait.

1
Chi Square Tests Chapter 17

2
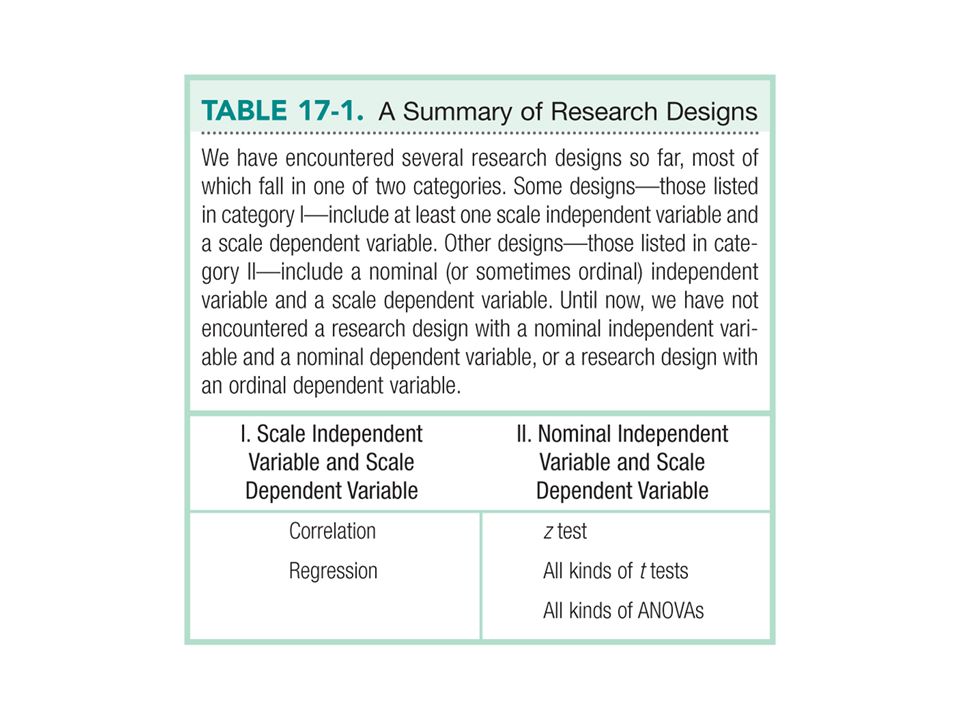
Assumptions for Parametrics >Normal distributions >DV is at least scale >Random selection Sometimes other stuff: homogeneity, homoscedasticity

4
Nonparametrics >Specifically, for when the DV is NOT a scale variable. DV is nominal (frequency counts of categories) DV is ordinal (rankings of categories) IV is usually also one of these things as well.
 DV is ordinal (rankings of categories) IV is usually also one of these things as well..")
5
>Used when the sample size is small >Used when underlying population is not normal Nonparametrics

6
Limitations of Nonparametric Tests >Cannot easily use confidence intervals or effect sizes >Other things I don’t think are true: Have less statistical power than parametric tests Nominal and ordinal data provide less information

7
Two types of Chi-Square >Goodness of fit test For when you have ONE nominal variable >Independence test For when you have TWO nominal variables

8
Goodness of Fit Test >Step 1: list the variable involved Statistics classes

9
Goodness of Fit Test >Step 2: chi-square is all about expected fit How much does the the data match what we would expect if these categories were assigned by chance?

10
Goodness of Fit Test >Step 2: Observed statistic test categories match the expected variables (O = E) Observed statistic test categories do not match the expected variables (O/=E)
 Observed statistic test categories do not match the expected variables (O/=E)")
11
>Step 3: List the observed and expect values >List the df Goodness of Fit Test

12
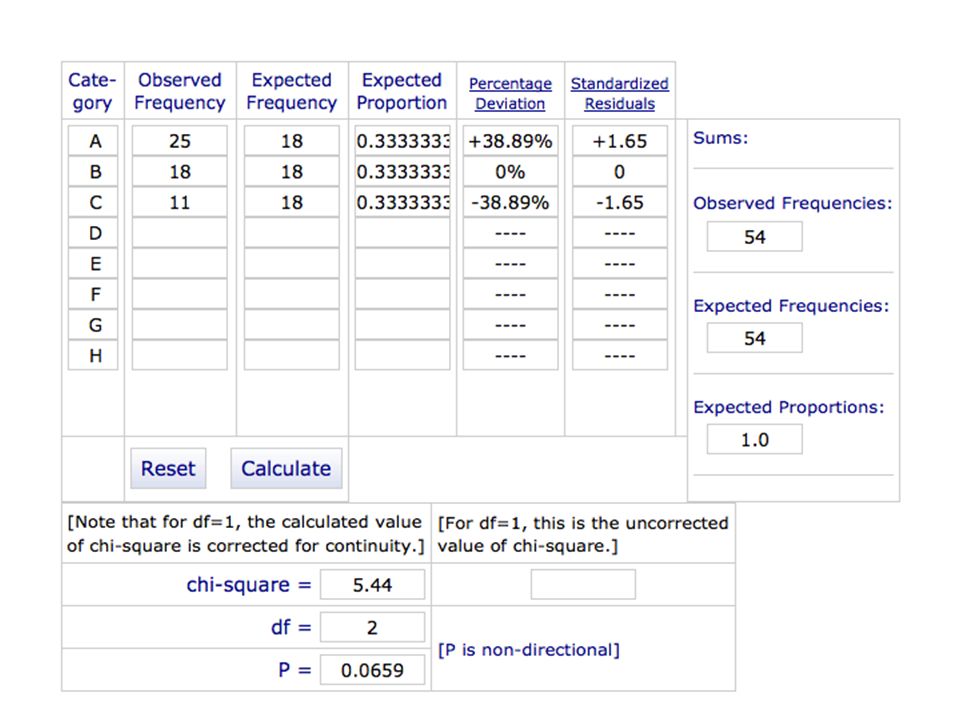
>Two ways to do expected values: N (total number of people) / Number of categories OR N (total number of people) * expected proportion for that category Goodness of Fit Test
 / Number of categories OR N (total number of people) * expected proportion for that category Goodness of Fit Test")
13
PSY 200SOC 302MTH 340 A grades251811 PSY 200SOC 302MTH 340 A grades18 observed expected

14
Goodness of Fit Test >df Number of Categories – 1 3 – 1 = 2

15
Goodness of Fit Test >Step 4: Cut off score (5.992) >Use a chi-square table
 >Use a chi-square table")
16
Goodness of Fit Test http://vassarstats.net/csfit.html Step 5: List chi-square = 5.44

18
Goodness of Fit Test >Step 6: Is the found chi-square value > the cut off chi-square value? This test is like F – everything is squared, so all values are positive. >Nope! Same number of As in each class.

19
Independence Test >Independence test for two nominal variables Are the observed values equal to the expect values given the combinations of categories?

20
Independence Test >Step 1: list the variables involved. >Professors and grade distributions

21
Independence Test >Step 2: chi-square is all about expected fit How much does the the data match what we would expect if these categories were assigned by chance?

22
Independence Test >Step 2: Observed statistic grades for each professor match the expected variables (O = E) Observed statistic grades for each professor do not match the expected variables (O/=E)
 Observed statistic grades for each professor do not match the expected variables (O/=E)")
23
Independence Test >Step 3: List the observed and expect values >List the df

24
Independence Test >df = (3-1)(3-1) = 4
(3-1) = 4")
25
Independence Test >Expected values: E = R*C / N E = expected R = row total C = column total N = total of everything

26
Independence Test ABCROW TOTALS Prof 156516 Prof 2124319 Prof 3119323 COLUMN TOTALS 281911N = 58 ABCROW TOTALS Prof 116*28/5816*19/5816*11/5816 Prof 219*28/5819*19/5819*11/5819 Prof 323*28/5823*19/5823*11/5823 COLUMN TOTALS 281911N = 58 observed expected

27
Independence Test ABCROW TOTALS Prof 17.725.243.0316 Prof 29.176.223.6019 Prof 311.107.534.3623 COLUMN TOTALS 281911N = 58

28
Independence Test >Step 4: Cut off score (9.488) >Use a chi-square table
 >Use a chi-square table")
29
Independence Test http://vassarstats.net/newcs.htm l Step 5: List chi-square = 4.82

30
Independence Test

31
>Step 6: Is the found chi-square value > the cut off chi-square value? This test is like F – everything is squared, so all values are positive. >Nope! Same number of ABC grades for each professor.

32
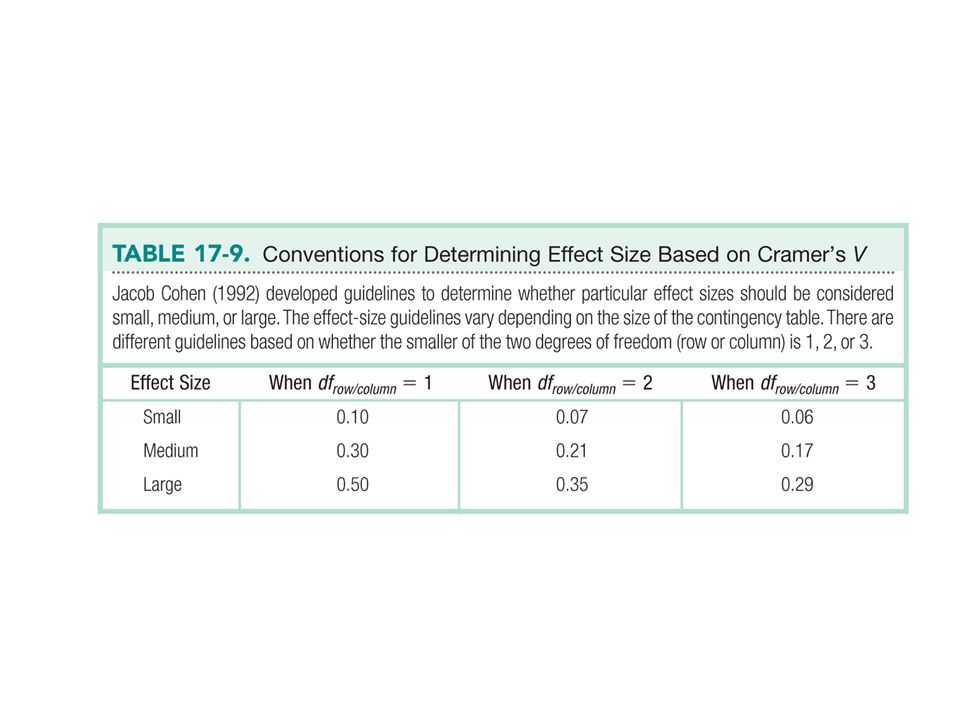
Cramer’s V (phi) >The effect size for chi-square test for independence df row/column = smaller number of (R-1) or (C-1)
 >The effect size for chi-square test for independence df row/column = smaller number of (R-1) or (C-1)")
Similar presentations


 Assumption of population normality 2) homogeneity of variance Parametric more powerful than nonparametric.>")


 Tests Chi-Square.>")


