Download presentation
Presentation is loading. Please wait.

1
Chi Square Tests Chapter 17

2
Nonparametric Statistics
A special class of hypothesis tests Used when assumptions for parametric tests are not met Review: What are the assumptions for parametric tests?

4
When to Use Nonparametric Tests
When the dependent variable is nominal What are ordinal, nominal, interval, and ratio scales of measurement? Used when either the dependent or independent variable is ordinal Used when the sample size is small Used when underlying population is not normal

5
Limitations of Nonparametric Tests
Cannot easily use confidence intervals or effect sizes Have less statistical power than parametric tests Nominal and ordinal data provide less information More likely to commit type II error Review: What is type I error? Type II error?

6
Chi-Square Test for Goodness-of-Fit
Nonparametric test when we have one nominal variable The six steps of hypothesis testing 1. Identify 2. State the hypotheses 3. Characteristics of the comparison distribution 4. Critical values 5. Calculate 6. Decide

7
Formulae

9
Determining the Cutoff for a Chi-Square Statistic

12
Making a Decision

13
A more typical Chi-Square
Evenly divided expected frequencies Can you think of examples where you would expect evenly divided expected frequencies in the population?

14
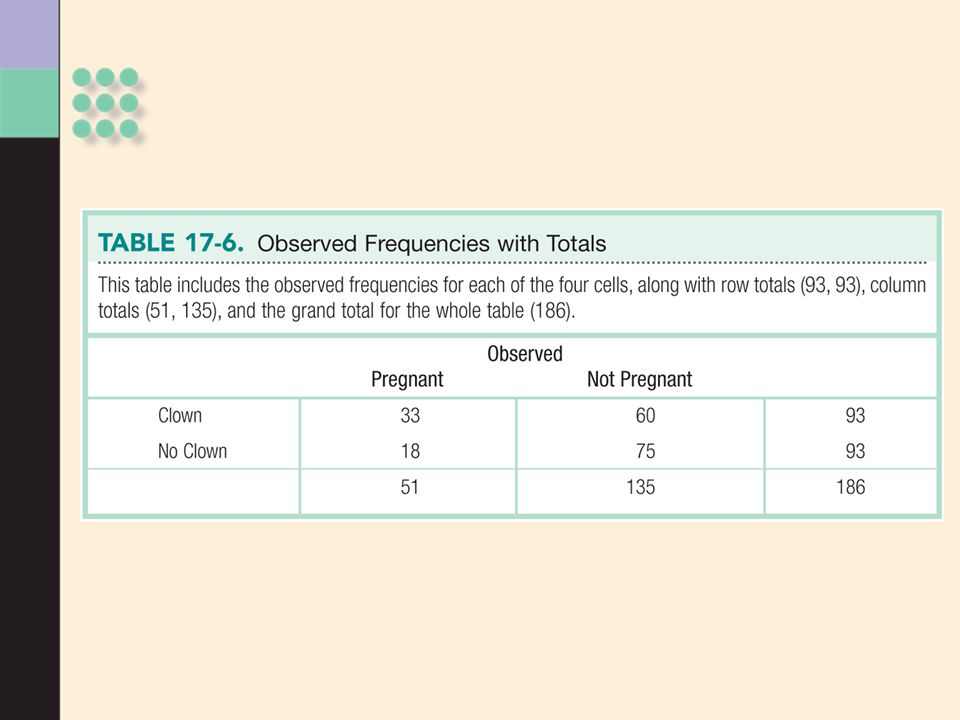
Chi-square test for independence
Analyzes 2 nominal variables The six steps of hypothesis testing 1. Identify 2. State the hypotheses 3. Characteristics of the comparison distribution 4. Critical values 5. Calculate 6. Decide

16
The Cutoff for a Chi-Square Test for Independence

20
The Decision

21
Cramer’s V (phi) The effect size for chi-square test for independence
 The effect size for chi-square test for independence")
23
Graphing Chi-Squared Percentages

24
Relative Risk We can quantify the size of an effect with chi square through relative risk, also called relative likelihood. By making a ratio of two conditional proportions, we can say, for example, that one group is three times as likely to show some outcome or, conversely, that the other group is one-third as likely to show that outcome.

25
Adjusted Standardized Residuals
The difference between the observed frequency and the expected frequency for a cell in a chi-square research design, divided by the standard error; also called adjusted residual.

Similar presentations