Download presentation
Presentation is loading. Please wait.

1
Engineering Probability and Statistics - SE-205 -Chap 1 By S. O. Duffuaa

2
Course Objectives w Introduce the students to basic probability and statistics and demonstrate its wide application in the area of Systems Engineering.

3
Main Course Outcomes w Students should be able to perform: Summarize and present data Describe probability distributions Compute probabilities using density/mass functions Conduct interval estimation Make inference about populations Use statistical package/Minitab

4
Text Book and References w “Applied Statistics and Probability for Engineers “ by D. C. Montgomery and Runger, 1994. w “Probability and Statistics for Engineers and Scientists” 5 th by Walpole and Mayers. w Statistics by Murry Speigel

5
Course Policy w Home-works and attendance 15% w Quizzes 15% w Exam1 20% w Exam II 20% w Final Exam 30%

6
SE- 205 Place in SE Curriculum w Central Course w Prerequisite for 7 SE courses SE 303, SE 320, SE 323, SE 325, SE 447, SE 480, SE 463 and may be others. See SE Curriculum Tree

7
Engineering Problem Solving w Develop clear and concise problem description w Identify the important factors in the problem. w Propose a model for the problem w Conduct appropriate experimentation w Refine the model

8
Engineering Problem Solving w Validate the solution w Conclusion and recommendations

9
Statistics Science of data collection, summarization, presentation and analysis for decision making. How to collect data ? How to summarize it ? How to present it ? How do you analyze it and make conclusions and correct decisions ?

10
Role of Statistics w Many aspects of Engineering deals with data – Product and process design w Identify sources of variability w Essential for decision making

11
Data Collection w Observational study Observe the system Historical data w The objective is to build a system model usually called empirical models

12
Data Collection w Design of experiment Plays key role in engineering design

13
Statistics w Divided into : Descriptive Statistics Inferential Statistics

14
Forms of Data Description w Point summary w Tabular format w Graphical format w Diagrams

15
Point Summary w Central tendency measures Mean x i /n Median --- Middle value Mode --- Most frequent value

16
Point Summary w Variability measures Range = Max x i - Min x i Variance = V = (x i – x ) 2 / n-1 Standard deviation = S S = Square root (V) Coefficient of variation = S/ x
 2 / n-1 Standard deviation = S S = Square root (V) Coefficient of variation = S/ x")
17
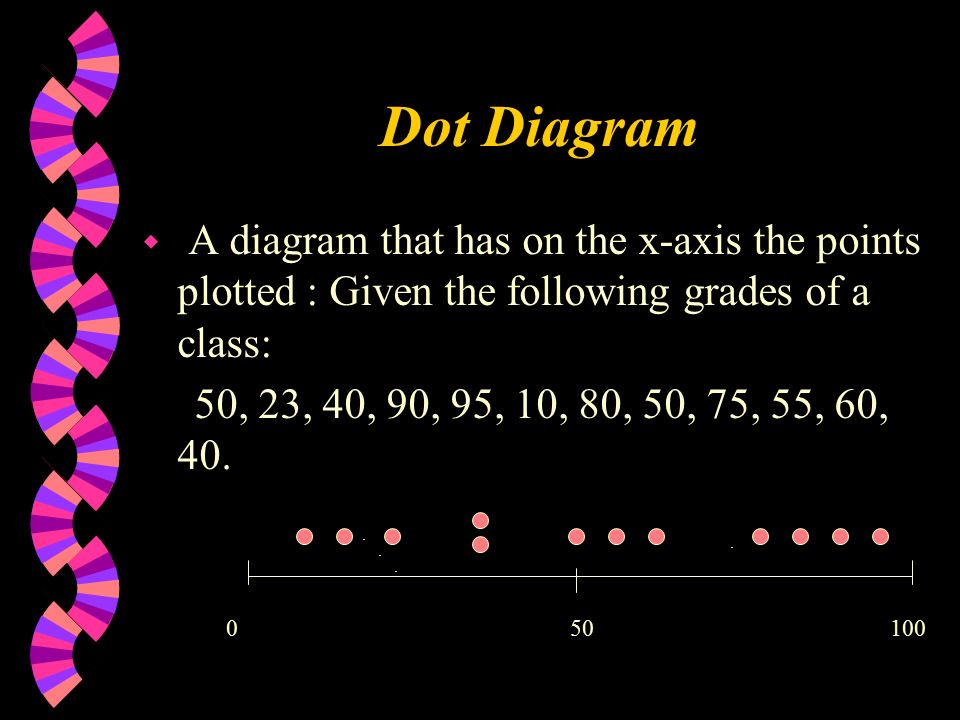
Dot Diagram w A diagram that has on the x-axis the points plotted : Given the following grades of a class: 50, 23, 40, 90, 95, 10, 80, 50, 75, 55, 60, 40. 010050....
18
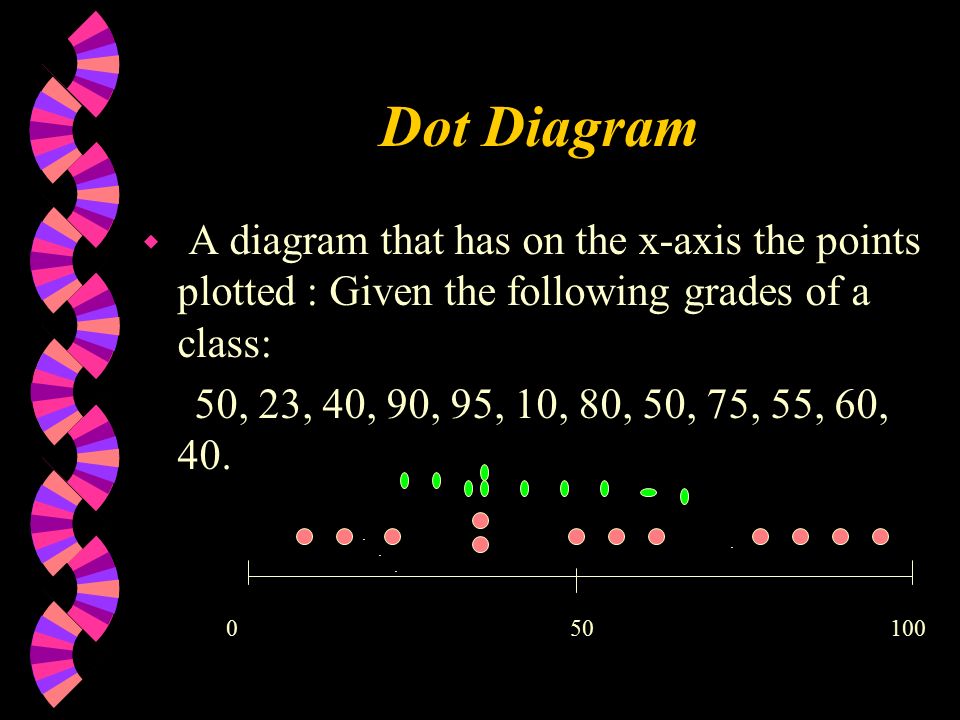
Dot Diagram w A diagram that has on the x-axis the points plotted : Given the following grades of a class: 50, 23, 40, 90, 95, 10, 80, 50, 75, 55, 60, 40. 010050....
19
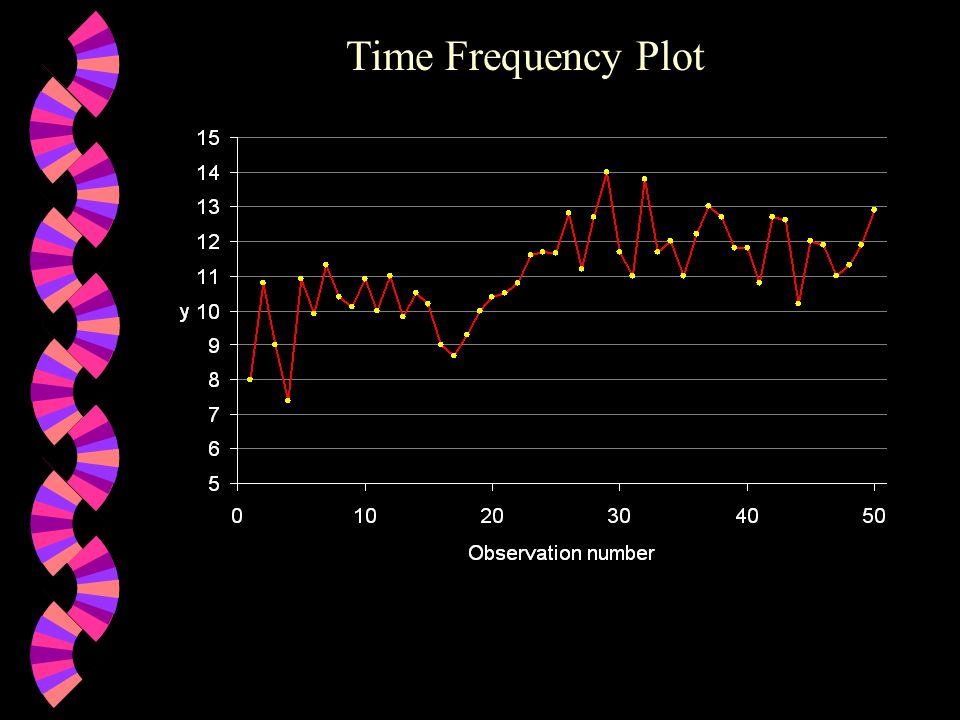
Time Frequency Plot

21
Lower control limit = 82.54 x = 91.50 Upper control limit = 100.5 Control Charts

Similar presentations