Download presentation
Presentation is loading. Please wait.

1
Multivariate Visualization

2
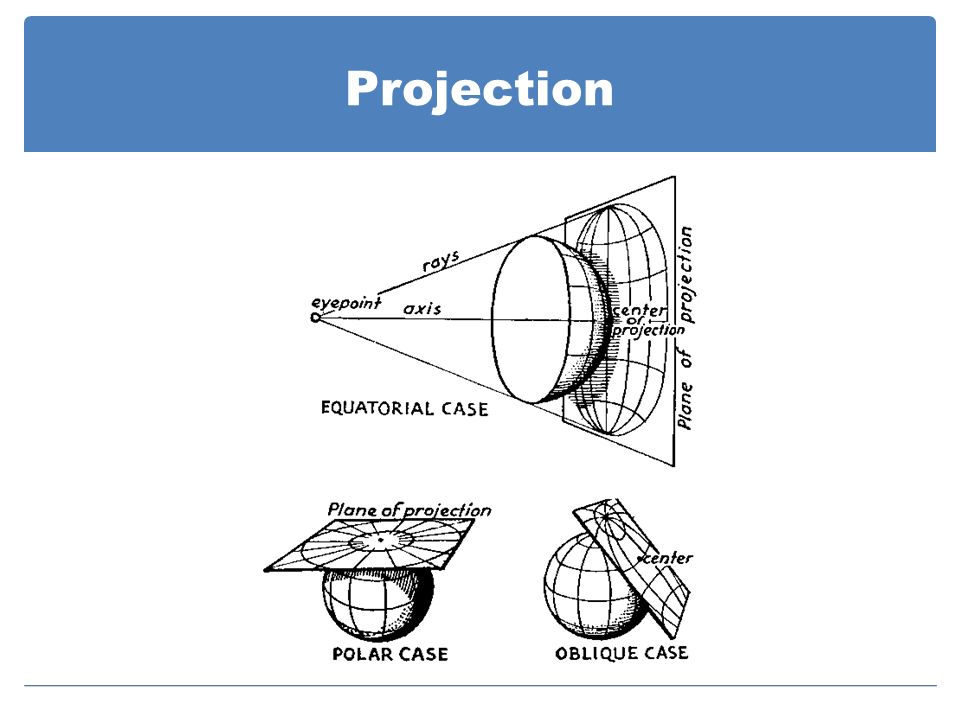
Projection

5
Distortion

6
Parallel Coordinates

7
Pairwise Comparisons

8
Graphical Excellence Minimize non-data ink Allow data ink to perform more than one purpose Carry data information Serve a design function Show multiple pieces of data Multifunctioning Graphical Elements

9
Principles Mobilize every graphical element, perhaps several times over, to show the data

10
Tufte pg 152

11
Data-Built Data Measures Graphical element that plots the data: data measure Ayres (1919) Number of divisions Which divisions Duration of stay
 Number of divisions Which divisions Duration of stay")
12
Dot Maps

13
Chernoff Faces

16
Bubble Plot Authorline chat thread Red: initiated by author Blue: initiated by someone else http://www.cmu.edu/joss/content/articles/volume8/Welser/

17
Color

19
Principles Mobilize every graphical element, perhaps several times over, to show the data Maximize Data Density and the size of the Data Matrix Data rich context and credibility

20
Small Multiples Graphics can be shrunk Series of graphics showing same combination of variables Indexed by changes in another variable

21
El Nino

22
http://www.nytimes.com/packages/html/politics/2004_ELECTIONGUIDE_GRAPHIChttp://www.nytimes.com/packages/html/politics/2004_ELECTIONGUIDE_GRAPHIC/

23
Interaction http://www.nytimes.com/interactive/2008/02/23/mo vies/20080223_REVENUE_GRAPHIC.html http://www.nytimes.com/interactive/2008/02/23/mo vies/20080223_REVENUE_GRAPHIC.html http://douweosinga.com/

Similar presentations


>")


 Distribution of values for single variables.>")


