Download presentation
Presentation is loading. Please wait.

1
North American Drought in the 21st Century Project Overview Dennis P. Lettenmaier University of Washington Eric F. Wood Princeton University Gordon Bonan National Center for Atmospheric Research Climate Change Prediction Program PI Meeting Seattle October 18, 2004

2
Central science question: What is the susceptibility of the continental U.S. to drought over the next century, and what role is anthropogenic warming likely to play in U.S. drought susceptibility?

3
Drought: Most Costly Natural Disaster Average damages in U.S.: $6-8 billion/year Major impacts: agricultural municipal industrial environmental

4
“We propose to use the Community Climate System Model (CCSM), in conjunction with a modified version of the Community Land Model (CLM) that will incorporate a more realistic representation of land surface hydrology, to evaluate the susceptibility of the U.S. to drought over the next century.”

5
Subsidiary questions: a) What have been the space-time signatures of 20th century drought on precipitation, soil moisture, and streamflow, and how might those change in the 21st century? b) What is the role of climate-vegetation feedbacks in exacerbating or ameliorating North American drought severity and intensity? c) Can useful estimates of drought recovery probabilities be developed based on off-line and or coupled ensemble climate prediction methods?
 What is the role of climate-vegetation feedbacks in exacerbating or ameliorating North American drought severity and intensity. c) Can useful estimates of drought recovery probabilities be developed based on off-line and or coupled ensemble climate prediction methods .")
6
Tasks: Task 1: Improve land surface hydrology representation in CLM. (By “transplanting” aspects of the runoff generation, soil column representation, and possibly the snow model from the Variable Infiltration Capacity (VIC) model into CLM) Task 2: Perform offline tests of upgraded version of CLM. (Specifically using updated PILPS-2c data for the Arkansas-Red River basin, and other PILPS data) Task 3: Evaluate performance of upgraded model in climate simulations. (Focus on the period 1950-present, for which CCSM runs with observed SSTs can be compared with off-line land surface simulations) Task 4: Simulate and evaluate projected drought characteristics. (To be based on transient climate simulations for the period 1870-2100) Task 5: Drought recovery evaluation. (Explore the possibility of using coupled and/or off-line simulations to evaluate alternate methods of estimating drought recovery.) Task 6: High resolution simulations for the U.S. (Develop a prototype high-resolution version of the CLM that runs on a finer spatial grid than the current CLM – perhaps 1/8 degree LDAS grid for the U.S.)
 model into CLM) Task 2: Perform offline tests of upgraded version of CLM. (Specifically using updated PILPS-2c data for the Arkansas-Red River basin, and other PILPS data) Task 3: Evaluate performance of upgraded model in climate simulations. (Focus on the period 1950-present, for which CCSM runs with observed SSTs can be compared with off-line land surface simulations) Task 4: Simulate and evaluate projected drought characteristics. (To be based on transient climate simulations for the period ) Task 5: Drought recovery evaluation. (Explore the possibility of using coupled and/or off-line simulations to evaluate alternate methods of estimating drought recovery.) Task 6: High resolution simulations for the U.S. (Develop a prototype high-resolution version of the CLM that runs on a finer spatial grid than the current CLM – perhaps 1/8 degree LDAS grid for the U.S.).")
7
Hydrologic Model Variable Infiltration Capacity (VIC) Model Features: Developed over 10+ years Energy and water budget closure at each time step Multiple vegetation classes in each cell Sub-grid elevation band definition (for snow) Subgrid infiltration/runoff variability History of application to many large (continental) river basins
 Model Features: Developed over 10+ years Energy and water budget closure at each time step Multiple vegetation classes in each cell Sub-grid elevation band definition (for snow) Subgrid infiltration/runoff variability History of application to many large (continental) river basins")
8
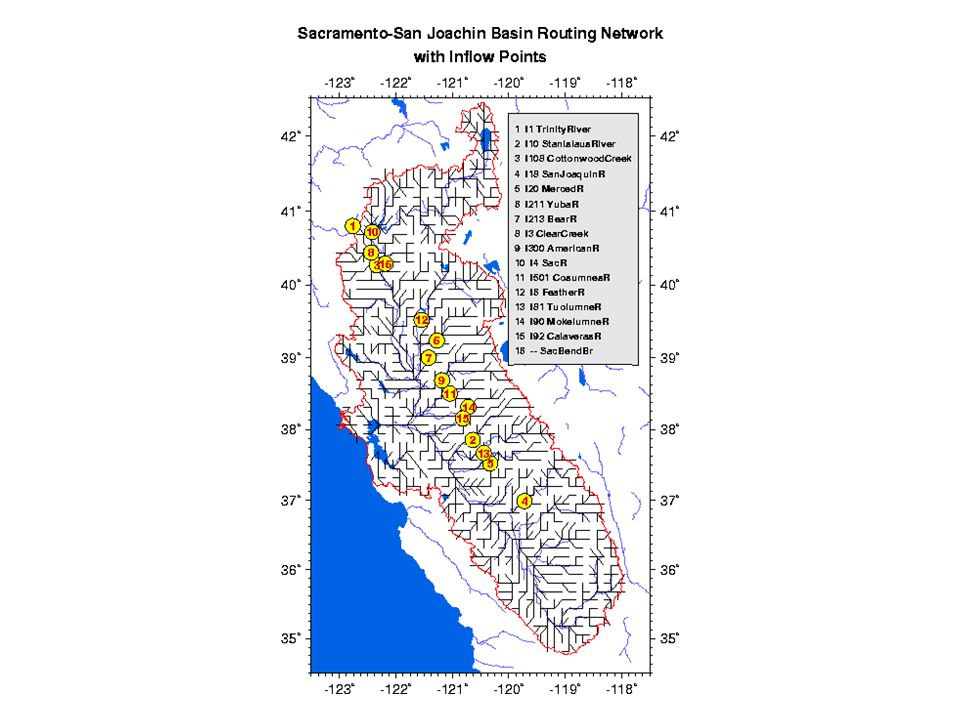
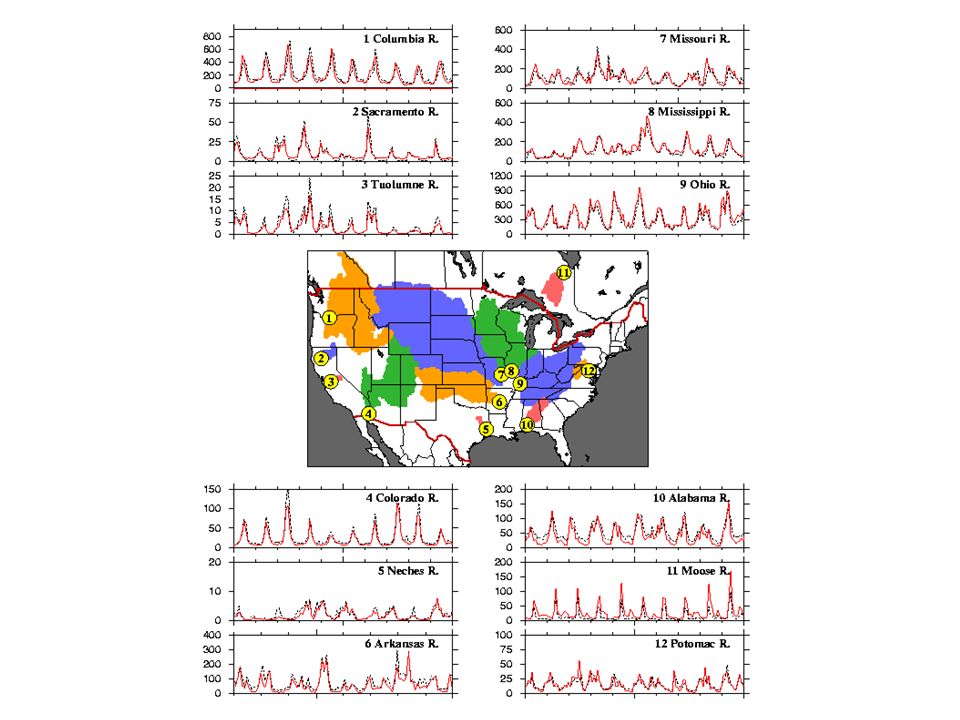
Macroscale modeling approach (“top down”) 1 Northwest5 Rio Grande10 Upper Mississippi 2 California6 Missouri11 Lower Mississippi 3 Great Basin7 Arkansas-Red12 Ohio 4 Colorado8 Gulf13 East Coast 9 Great Lakes
 1 Northwest5 Rio Grande10 Upper Mississippi 2 California6 Missouri11 Lower Mississippi 3 Great Basin7 Arkansas-Red12 Ohio 4 Colorado8 Gulf13 East Coast 9 Great Lakes")
11
Comparison with Illinois Soil Moisture 19 observing stations are compared to the 17 1/8º modeled grid cells that contain the observation points. Persistence Moisture Level Moisture Flux Variability Obs. Model Maurer et al., 2002

12
SWE, 1981

13
Drought Definitions Meteorological Drought –Precipitation and Temperature Agricultural Drought –Soil Moisture Hydrologic Drought –Streamflow/Runoff http://nm.water.usgs.gov/drought/photos.htm

14
How can we use information from long term hydrologic model simulations to synthesize the following drought characteristics: severity, intensity, extent, and duration?

15
Severity-Area-Duration Analysis Based on the Depth-Area-Duration technique from probable maximum precipitation analysis Replace depth with measure of drought severity S=(1-ΣP/t) –S=severity, ΣP = cumulative percentile (soil moisture or runoff), t = duration
 –S=severity, ΣP = cumulative percentile (soil moisture or runoff), t = duration")
16
How do we define drought extent?

18
SAD Construction 1.Rank cells by severity & identify potential drought centers 2.Search 3x3 neighborhood of drought center 3.Average severities & add areas 4.Output severity and area at specified area intervals 5.Compare the severity at ~25,000 km 2 for each potential drought center and select center with maximum severity Modified from WMO (1960) computational method of DAD analysis 1) 2) 3)
 computational method of DAD analysis 1) 2) 3)")
19
Methodology VIC model output Total column soil moisture Runoff Weibull percentiles Threshold 20 th percentile and lower soil moisture 30 th percentile and lower runoff Spatial contiguity Initial drought classification Temporal contiguity Final drought and subdrought classification Severity-Area- Duration SAD curves for each event Highest severities Envelope curve for each duration

20
Soil Moisture 3-month 6-month 1 year 2 years 4 years 8 years Dec 1976 to Feb 1977 Feb 2002 to Feb 2003 Feb 1930 to Feb 1937 Oct 1951 to Oct 1956

21
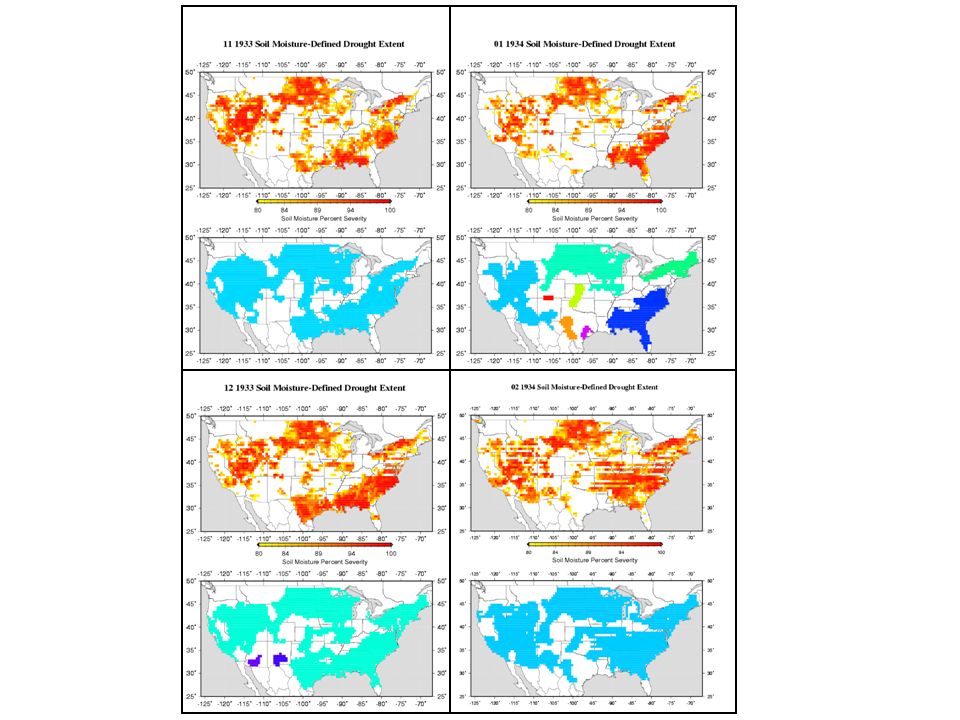
Runoff 3-month 6-month 1 year 2 years 4 years 8 years Feb 2001 to Feb 2002 Sep 1976 to Nov 1976 Jan 1934 to Mar 1934 Sep 1953 to Sep 1956

22
Runoff vs. Soil moisture Lower severities at higher areas and longer durations for runoff Current drought more dominant in runoff due to sensitivity to precipitation deficit?

23
Summary Proposal is to merge best aspects of CLM and VIC, with emphasis on producing a land surface scheme that is capable of reproducing observed land surface hydrologic dynamics of major river basins Most likely aspects of VIC to be integrated into CLM are runoff production parameterizations (variable infiltration capacity curve; baseflow parameterization) and perhaps snow model; energetics and vegetation parameterizations will likely be retained Drought severity-area-duration analysis (SAD) will be the mechanism for investigation of implications of future climate for drought (through both off-line and coupled applications)
 and perhaps snow model; energetics and vegetation parameterizations will likely be retained Drought severity-area-duration analysis (SAD) will be the mechanism for investigation of implications of future climate for drought (through both off-line and coupled applications)")
Similar presentations


![Figure 1: Schematic representation of the VIC model. 2. Model description Hydrologic model The VIC macroscale hydrologic model [Liang et al., 1994] solves.](/24/7054986/big_thumb.jpg "Figure 1: Schematic representation of the VIC model. 2. Model description Hydrologic model The VIC macroscale hydrologic model [Liang et al., 1994] solves.>")


