Download presentation
Presentation is loading. Please wait.

1
Advances in Macroscale Hydrology Modeling for the Arctic Drainage Basin Dennis P. Lettenmaier Department of Civil and Environmental Engineering University of Washington 53 rd Arctic Science Conference University of Alaska Fairbanks September 19, 2002

2
Thermohaline Circulation G. Holloway, Institute of Ocean Sciences, Sidney, BC

3
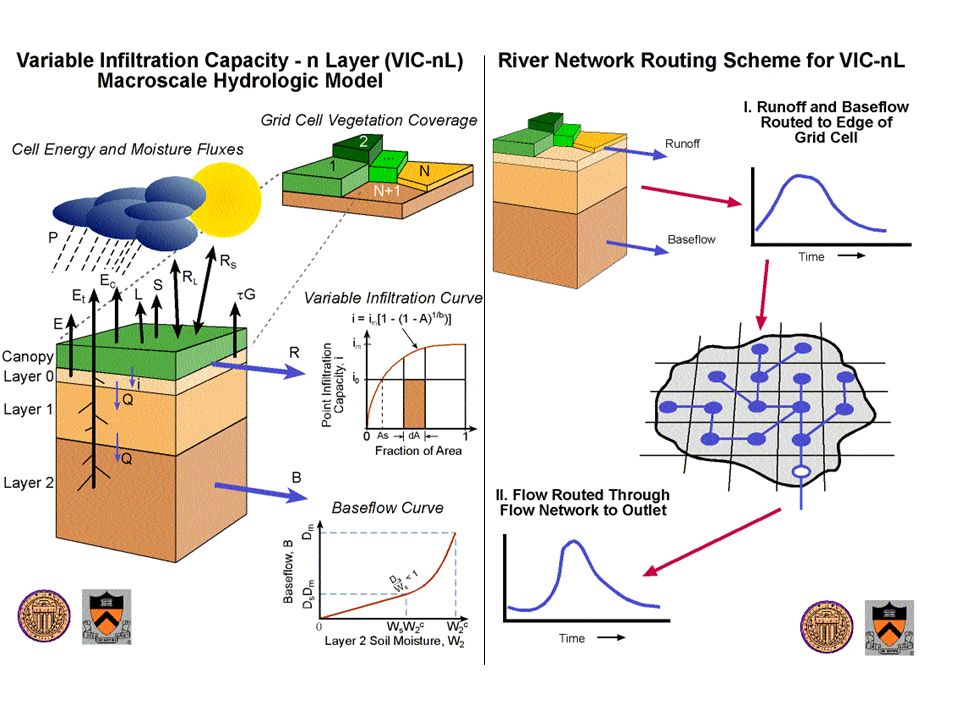
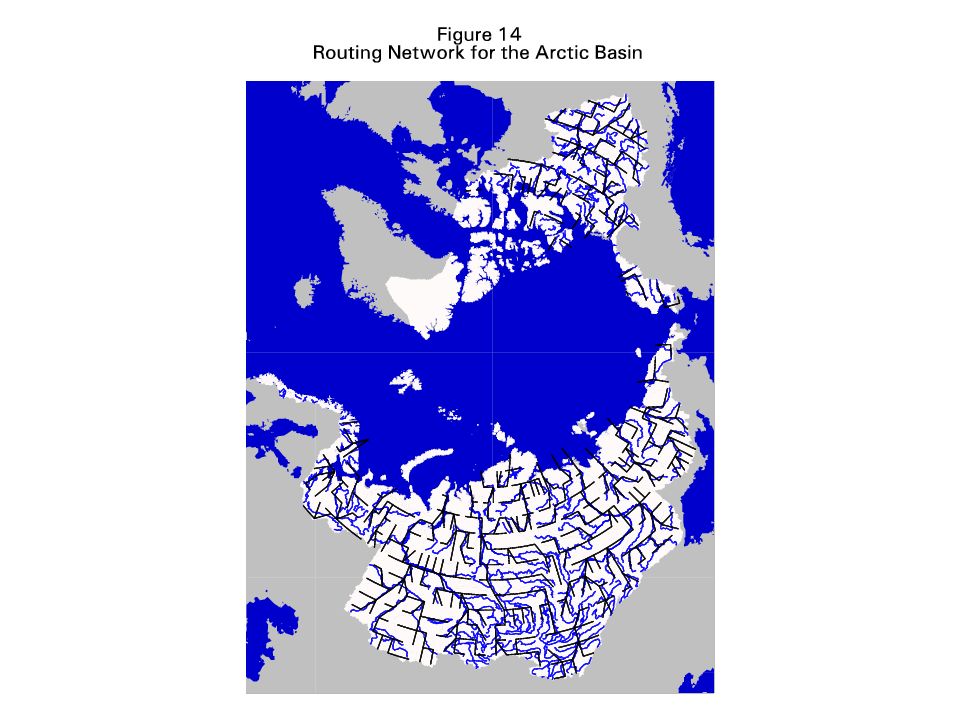
Arctic drainage basin Ob Mackenzie Lena Yenesei gauged area ungauged area

6
Mackenzie River basin early version VIC snow season length results RS T Index Energy Balance

7
Ob River basin early version VIC snow season length results RS T Index Energy Balance

8
21 participating land surface models (typically land surface representations in coupled land- atmosphere models, representing surface energy and water balances Study site: Torne-Kalix River basin (Sweden and Finland), ~58,000 km 2 Each model provided ~10 years of gridded (1/4 degree) surface radiative and meteorological forcings Streamflow, snow extent, and surface water balance observed or inferred from observations PILPS (Project for Intercomparison of Land surface Parameterization Schemes) Experiment 2e
, ~58,000 km 2 Each model provided ~10 years of gridded (1/4 degree) surface radiative and meteorological forcings Streamflow, snow extent, and surface water balance observed or inferred from observations PILPS (Project for Intercomparison of Land surface Parameterization Schemes) Experiment 2e")
9
Figure 1. Location of the Torne and Kalix Rivers (red) within the BALTEX domain (white)
 within the BALTEX domain (white)")
10
Mean annual snowfall apportionment to melt and sublimation

11
Predicted annual average latent heat flux (1989 – 1998) and estimate from basin water balance
 and estimate from basin water balance")
12
Predicted average last day of snow cover (1989 – 1998) and satellite estimate
 and satellite estimate")
13
PILPS-2e Conclusions Inter-model variations in mean annual runoff were primarily related to winter snow sublimation, even though summer ET was much higher. Storage of snowmelt runoff in the soil column primarily influenced the timing of peak runoff, rather than volume. Models with high sublimation generally lost their snow pack too early and underpredicted annual runoff. Differences in snow sublimation were largely a result of differences in snow surface roughness. The greatest among-model differences in energy and moisture fluxes occurred during the spring snowmelt period. Differences in net radiation were governed by differences in the surface temperature during winter, and by differences in surface albedo during snowmelt, but were minor when snow was absent The formulation of aerodynamic resistance and stability corrections in areas of no overstory were at least as important as the sensitivity to representation of canopy interception in explaining intermodel differences in winter evaporation.

15
Lakes and wetlands Source: San Diego State University Global Change Research Group

16
Landcover from Landsat MSS images (Muller et al. 1999). Putuligayuk River
. Putuligayuk River")
17
Snowmelt water balance 1999 2000 2001

18
Saturated extent 1999 and 2000 20002000 = wet = dry a. b. c. d.e.

19
Predicting the effects of lakes and wetlands Lake energy balance based on: –Hostetler and Bartlein (1990) –Hostetler (1991) Assumptions: –One “effective” lake for each grid cell; –Laterally-averaged temperatures; and
 –Hostetler (1991) Assumptions: –One effective lake for each grid cell; –Laterally-averaged temperatures; and")
20
Lake energy balance

21
Lake surface energy balance Mean daily values, June-August 2000 Mean diurnal values, June-August 2000 ‘Lake 1’, Arctic Coastal Plain, Alaska

22
Observed Simulated Mean temperature profile (1993-1997) Toolik Lake, Alaska
 Toolik Lake, Alaska")
23
Lake ice formation and break-up Torne River, Sweden ice formationice break-up = area > 20 km 2 = area < 20 km 2

24
Wetland Algorithm soil saturated land surface runoff enters lake evaporation depletes soil moisture lake recharges soil moisture

25
Simulated saturated extent Putuligayuk River, Alaska

26
Simulated mean annual evaporation with lake algorithmwithout lake algorithm Simulated annual evaporation increases by 60%

27
Blowing Snow Günter Eisenhardt 3.31.2002, Iceland

28
Distribution of terrain slopes Trail Valley Creek, NWTImnavait Creek, Alaska

29
Sub-grid variability in wind speed Wind speeds assumed to follow a Laplace (double exponential) distribution Requires the standard deviation of wind speed, proportional to: –grid cell mean wind speed –standard deviation of terrain slope –autocorrelation of terrain slope Total sublimation flux found by summing sublimation for the average wind speed of ten equally-probable intervals
 distribution Requires the standard deviation of wind speed, proportional to: –grid cell mean wind speed –standard deviation of terrain slope –autocorrelation of terrain slope Total sublimation flux found by summing sublimation for the average wind speed of ten equally-probable intervals")
30
Non-equilibrium Transport average fetch, f transport = 0transport = Q t (x= f) snow
 snow")
31
Estimating average fetch vegetation type terrain slopeterrain st. dev

32
Simulated annual sublimation from blowing snow Sensitivity to fetch

33
SWE and active layer depth

Similar presentations

 --- Department of Civil and Environmental Engineering University of Washington Dec, 2009.>")

 National Center.>")


 Dennis P. Lettenmaier and Fengge Su.>")

![Figure 1: Schematic representation of the VIC model. 2. Model description Hydrologic model The VIC macroscale hydrologic model [Liang et al., 1994] solves.](/24/7054986/big_thumb.jpg "Figure 1: Schematic representation of the VIC model. 2. Model description Hydrologic model The VIC macroscale hydrologic model [Liang et al., 1994] solves.>")


