Download presentation
Presentation is loading. Please wait.

1
¿Who Graduates?

2
First the good news:

3
http://www.census.gov/hhes/socdemo/education/data/cps/historical/

4
“In 2012, for the first time ever, one- third of the nation’s 25- to 29-year- olds have completed at least a bachelor’s degree. These across-the- board increases have occurred despite dramatic immigration-driven changes in the racial and ethnic composition of college-age young adults, a trend that had led some experts to expect a decline in educational attainment. College completion is now at record levels among key demographic groups: men and women; blacks, whites and Hispanics; and foreign- born and native-born Americans.” Released: November 5, 2012 http://www.pewsocialtrends.org/2012/11/05/record-shares-of-young-adults-have-finished-both-high-school-and- college September 28, 2015 http://www.pewhispanic.org/2015/09/28/chapter-3-the-changing-characteristics-of -recent-immigrant-arrivals-since-1970/

5
May 21, 2013 http://www.edweek.org/ew/section/infographics/graduation-rates-stats-infographic.html

6
Updating to 2013 (latest available…) data Graduation Rate Hits High, But Some Groups Lag 29 May 2015 The on-time graduation rates in the nation’s public high schools have hit historic highs. The U.S. Department of Education reports that 81 percent of the class of 2013 graduated within four years, as tabulated by the Adjusted Cohort Graduation Rate (ACGR). The ACGR, which states use to fulfill accountability requirements under the No Child Left Behind law, has climbed 2 percentage points since 2011, when the Education Department first started requiring states to calculate and report graduation rates using this method. … The gap between the highest- and lowest-performing jurisdictions was 28 percentage points in 2013. At one end of the scale was Iowa, with a graduation rate of 90 percent; at the other end, 62 percent of the class of 2013 graduated on time in the District of Columbia. … Students with disabilities, the focus of Diplomas Count 2015, have a 62 percent on-time graduation rate, which is 19 percentage points lower than the overall national rate. http://www.edweek.org/ew/articles/2015/06/04/graduation-rate-hits-high-but-some-groups.html?intc=EW-DC15-LNAV ACGR: The four-year adjusted cohort graduation rate is the number of students who graduate in four years with a regular high school diploma divided by the number of students who form the adjusted cohort for the graduating class. For any given cohort, students who are entering grade 9 for the first time form a cohort that is subsequently “adjusted” by adding any students who transfer into the cohort later during the next three years and subtracting any students who transfer out, emigrates to another country, or dies during that same period.
. The ACGR, which states use to fulfill accountability requirements under the No Child Left Behind law, has climbed 2 percentage points since 2011, when the Education Department first started requiring states to calculate and report graduation rates using this method. … The gap between the highest- and lowest-performing jurisdictions was 28 percentage points in At one end of the scale was Iowa, with a graduation rate of 90 percent; at the other end, 62 percent of the class of 2013 graduated on time in the District of Columbia. … Students with disabilities, the focus of Diplomas Count 2015, have a 62 percent on-time graduation rate, which is 19 percentage points lower than the overall national rate. intc=EW-DC15-LNAV ACGR: The four-year adjusted cohort graduation rate is the number of students who graduate in four years with a regular high school diploma divided by the number of students who form the adjusted cohort for the graduating class. For any given cohort, students who are entering grade 9 for the first time form a cohort that is subsequently adjusted by adding any students who transfer into the cohort later during the next three years and subtracting any students who transfer out, emigrates to another country, or dies during that same period..")
7
http://www.edweek.org/ew/articles/2014/06/05/34research.h33.html?intc=EW-DC14-LNAV

8
Our universities seem to do well… https://www.timeshighereducation.com/news/world-university-rankings-2015-2016-results-announced Times Higher Education World University Rankings 2015-2016Times Higher Education World University Rankings 2015-2016,

9
http://nces.ed.gov/nationsreportcard/naepdata/http://nationsreportcard.gov/

10
But internationally … US reading and STEM scores on P rogram for I nternational S tudent A ssessment EDUCATION WEEK Published in Print: January 12, 2012, as “U.S. Education Pressured by International Comparisons” By Sean CavanaghSean Cavanagh “Concern over American students' middling scores on high- profile tests vies with caution about cultural and political factors that shape school improvement …. ” EDUCATION WEEK Published in Print: January 12, 2012, as “U.S. Education Pressured by International Comparisons” By Sean CavanaghSean Cavanagh “Concern over American students' middling scores on high- profile tests vies with caution about cultural and political factors that shape school improvement …. ”

11
But wait a minute … http://nasspblogs.org/principaldifference/2010/12/pisa_its_poverty_not_stupid_1.html

13
Gasp! “A more accurate assessment of the performance of U.S. students would be obtained by comparing the scores of American schools with comparable poverty rates to those of other countries.” “Schools in the United States with less than a 10% poverty rate had a PISA score of 551. When compared to the ten countries with similar poverty numbers, that score ranked first.” http://nasspblogs.org/principaldifference/2010/12/pisa_its_poverty_not_stupid_1.html

14
Country Poverty Rate PISA Score United States <10% 551 Finland 3.4% 536 Netherlands 9.0% 508 Belgium 6.7% 506 Norway 3.6% 503 Switzerland 6.8% 501 France 7.3% 496 Denmark 2.4% 495 Czech Republic 7.2% 478 <10% poverty

15
10 – 24.9% poverty

16
“The problem is not as much with our educational system as it is with our high poverty rates. The real crisis is the level of poverty in too many of our schools and the relationship between poverty and student achievement. Our lowest achieving schools are the most under-resourced schools with the highest number of disadvantaged students. We cannot treat these schools in the same way that we would schools in more advantaged neighborhoods or we will continue to get the same results.” http://nasspblogs.org/principaldifference/2010/12/pisa_its_poverty_not_stupid_1.html

17
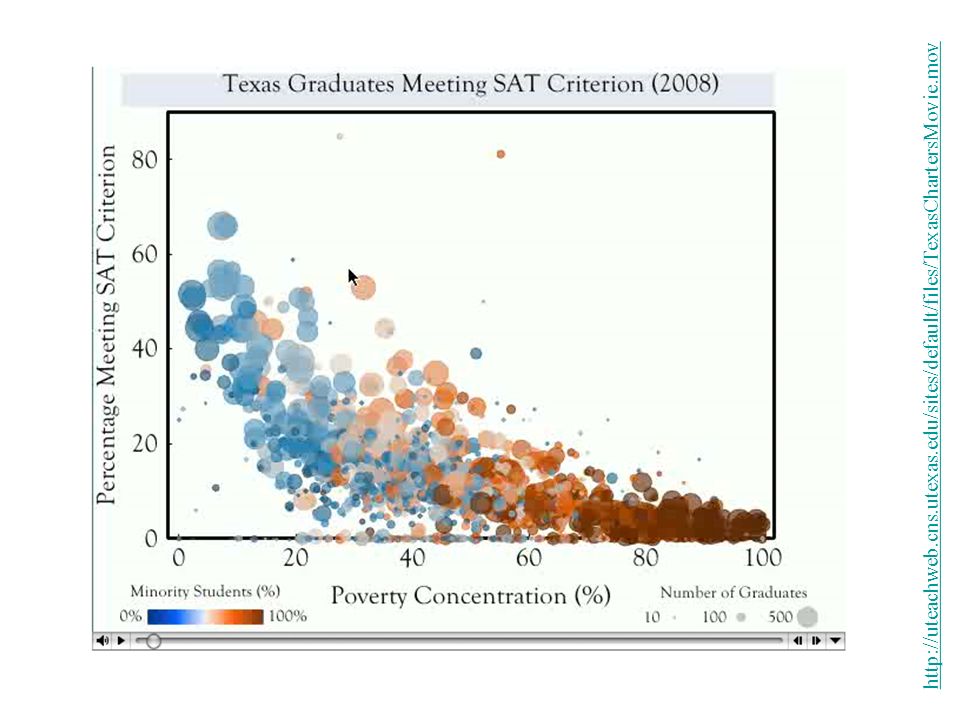
Yellow dots: US 0-10, 10-25, 25-50, avg, 50-75 and 75-100% kids in poverty http://uteachweb.cns.utexas.edu/Marder/Visualizations http://public.tableausoftware.com/views/PISAScoresvsPoverty/Sheet1?:embed=yes&:toolbar=yes&:tabs=no

18
http://uteachweb.cns.utexas.edu/sites/default/files/TexasChartersMovie.mov
19
http://www.edweek.org/media/2015/05/28/33dc-statebystate-gradrate-economicstatus-c1-2.jpg

20
Graduation rates for some subgroups Published online 29 May 2015 http://www.edweek.org/ew/dc/2015/map-graduation-rates-by-state-student-group.html?intc=EW-DC15-LNAV

21
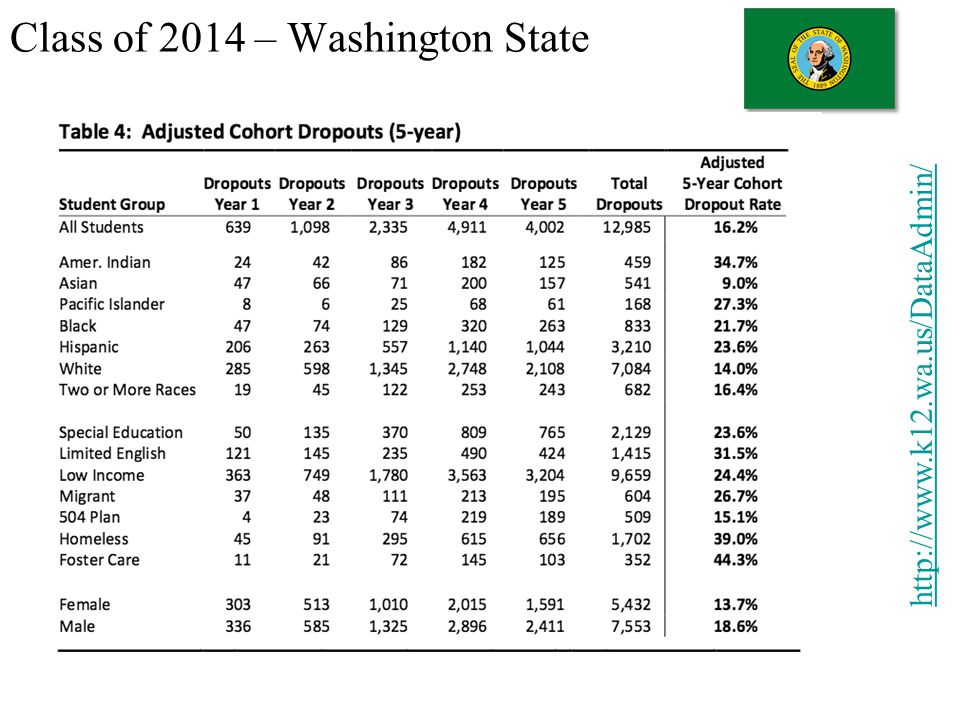
http://www.k12.wa.us/DataAdmin/ Class of 2014 – Washington State

22
http://www.k12.wa.us/DataAdmin/
23
Who does not graduate?

24
Why not?

25
http://www.k12.wa.us/dataadmin/ This is the latest report as of November, 2015 For more information on racial gaps and education, see http://www.usnews.com/news/blogs/data-mine/2015/01/28/us-education-still-separate-and-unequal (Thanks, Mutanda!)
")
27
Who is served? http://www.k12.wa.us/DataAdmin/

28
Who is served? http://www.k12.wa.us/DataAdmin/

29
Now some sad news: http://www.k12.wa.us/DataAdmin/

30
Adjusted Cohort Graduation Rate (four-year) Class of 2011 http://www.k12.wa.us/DataAdmin/
 Class of")
31
Now some bad news:

32
Who is served? http://www.k12.wa.us/DataAdmin/

33
Who is served?

36
Educating more people to a higher degree http://www.census.gov/population/www/socdemo/education/introphct41.html 27.4% 2008 84.5% 2008 http://factfinder.census.gov/

37
And on the WASL/HSPE: 82% of the class of 2011 who took the test passed the Reading HSPE. 86% passed the Writing HSPE. Only 66% passed the Year 2 Math test. (33% in 1998 -99) BUT…. Washington 4th graders’ NAEP test scores in math went from 17th in the nation (1996) to 9th in 2005. At the same time Washington’s African American 4th graders went from 13th to 1st. 8th graders’ NAEP scores in math went from 14th to 7th. Washington’s African American 8th graders went from 19th to 2 nd in the nation. http://seattletimes.nwsource.com/html/education/ 2016055610_testscores31m.html
 BUT…. Washington 4th graders’ NAEP test scores in math went from 17th in the nation (1996) to 9th in At the same time Washington’s African American 4th graders went from 13th to 1st. 8th graders’ NAEP scores in math went from 14th to 7th. Washington’s African American 8th graders went from 19th to 2 nd in the nation _testscores31m.html.")
Similar presentations


 2012 Science Results Carolyn M. Wood, Ph.D. Assistant Superintendent, Accountability, Assessment, and Data Systems August.>")


