Download presentation
Presentation is loading. Please wait.

1
Mapping for the Next Millennium How CrimeRisk™ scores are formed

2
F Criminological and Policy Theory dictates that for a particular area, there is a correlation between predicted crime levels and the amount of social disorganization and decline F Crime Score data is modeled by Applied Geographic Solutions (AGS) using techniques much like those used to predict economic trends and weather Basic Premise of Crime Scores
 using techniques much like those used to predict economic trends and weather Basic Premise of Crime Scores")
3
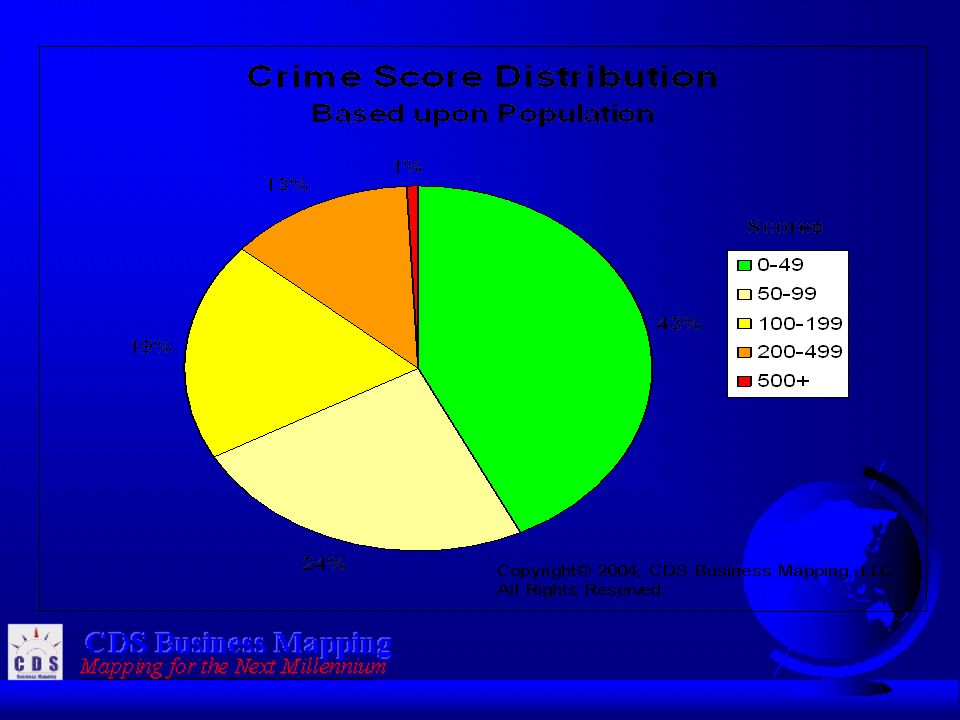
CrimeRisk Scores F Demonstrate the likelihood of crimes occurring in specific areas across the US F Scores range from 1-2000 –Score of 100 is equal to the national average Examples: u Score of 200 is 2x the national average u Score of 5 is extremely low

4
How the Model Is Built: F Demographic Clusters are related to crime scores –According to geodemographic segmentation, people tend to gravitate towards communities of similar backgrounds, interests, and means F Demographic Clusters break people down into 65 groups based on characteristics such as: u Age u Income u Education Level u Rural vs. Urban u Family Status u Employment u Housing Characteristics * race and ethnicity are NOT factors in building these scores

5
Crime Statistics: F The FBI collects data from about 16,000 law enforcement jurisdictions at city, county, and state levels F The FBI then compiles the data into its annual Uniform Crime Report (UCR) F Virtually all law enforcement agencies participate FBI Uniform Crime Reports, Local Police Data, National Crime Surveys
 F Virtually all law enforcement agencies participate FBI Uniform Crime Reports, Local Police Data, National Crime Surveys")
6
Correlating the Statistics F Crime data is correlated for each cluster F An average score is determined for each cluster F The scores are calculated for each Census Block Group by looking at the demographic make-up (% of each cluster) in each block
 in each block")
7
Indexes Produced F Aggregate Crime Index –Crimes Against Persons (Combines the 4 below) u Murder u Rape u Robbery u Assault –Crimes Against Property (Combines the 3 below) u Burglary u Larceny u Motor Vehicle Theft
 u Murder u Rape u Robbery u Assault –Crimes Against Property (Combines the 3 below) u Burglary u Larceny u Motor Vehicle Theft")
8
National Averages F 2001: latest fully published report per 100,000 –Murder 5.6 –Rape 31.8 –Robbery 148.5 –Assault 318.5 –Burglary 740.8 –Theft 2484.6 –Motor Vehicle Theft 430.6

10
RiskMeter Sample Report

11
Questions? For Further Information, Contact CDS Business Mapping 67 Broad St - 6th Floor Boston, MA 02109 617-737-4444 www.cdsys.com www.riskmeter.com

Similar presentations


 for Understanding the role of offender’s criminal history in violence against the police Donald Faggiani, University of Wisconsin.>")


