Download presentation
Presentation is loading. Please wait.

1
Data for Student Success May, 2010 Ann Arbor, MI “It is about focusing on building a culture of quality data through professional development and web based dynamic inquiries for school improvement.”

2
Introduction to the Grant Federal Title II Part D of the NCLB Act of 2001 Enhancing Education through Technology Grant awarded through CEPI

3
OUTCOMES: 1.IDENTIFY IMPORTANT TOPICS RELATED TO MME 2.LEARN MORE ABOUT MME STANDARDS, COMPONENTS, AND ASSESSMENT DESIGN 3.DEMONSTRATE AND EXPLORE THE NEW MME INQUIRIES

4
WHAT DO YOU KNOW ABOUT MME?

5
(SEE HANDOUT) MME Spring 2009 Assessment Design
 MME Spring 2009 Assessment Design")
6
(SEE HANDOUT) Spring 2009 MME Contributing Components
 Spring 2009 MME Contributing Components")
7
(SEE HANDOUT) Spring 2009 MME High School Content Standards by Subject
 Spring 2009 MME High School Content Standards by Subject")
8
www.data4ss.org
11
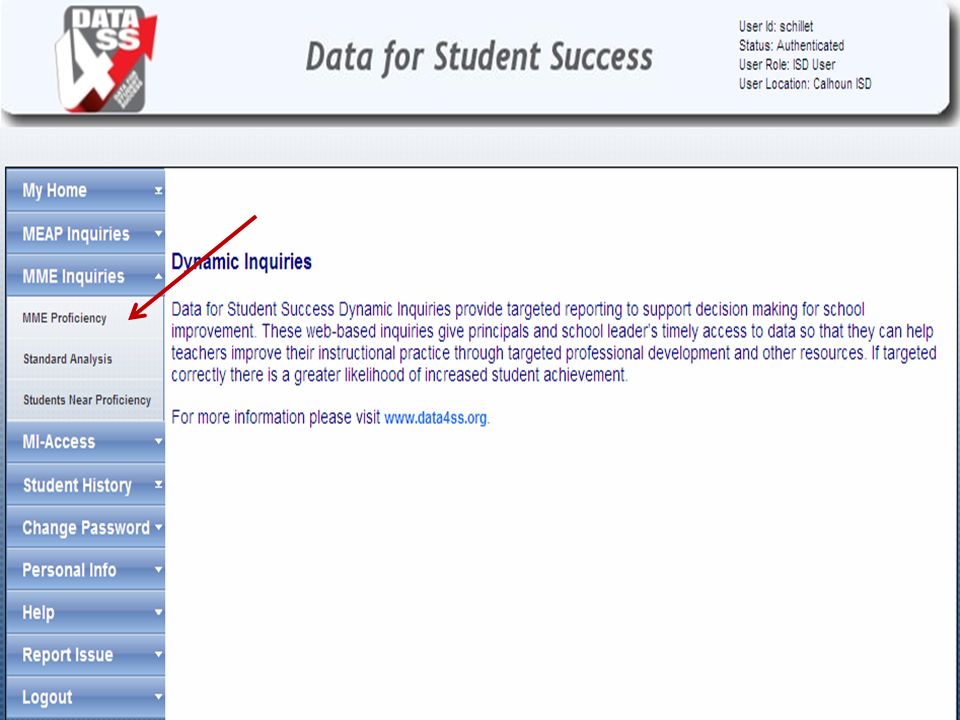
User name: demo_test1 Password: fall_01

14
School Year Reading/ELA Grade 34567811 2001-02 38% 31% 42% 2002-03 38% 31% 42% 2003-04 38% 31% 42% 2004-05 48% 43% 52% 2005-0650%48%46%45%43%41%52% 2006-0750%48%46%45%43%41%52% 2007-0860%59%57%56%54%53%61% 2008-0960%59%57%56%54%53%61% 2009-1070%69%68%67%66%65%71% 2010-1178%77%76%75%74%73%79% 2011-1286%85%84%83%82% 86% 2012-1393%92% 91% 93% 2013-14100% School Year Mathematics Grade 34567811 2001-02 47% 31%33% 2002-03 47% 31%33% 2003-04 47% 31%33% 2004-05 56% 43%44% 2005-0659%56%53%50%46%43%44% 2006-0759%56%53%50%46%43%44% 2007-0867%65%62%60%57%54%55% 2008-0967%65%62%60%57%54%55% 2009-1067%65%62%60%57%54%55% 2010-1175%74%71%70%67%66%67% 2011-1283%82%81%80%78%77%78% 2012-1391% 90% 89% 2013-14100% Michigan Annual AYP Objectives

25
School Data Dig Access your own school’s data You may use the templates provided to record your own MME data for –MME Proficiency 11 th grade –MME Proficiency Subgroups

26
MME Standard Analysis

27
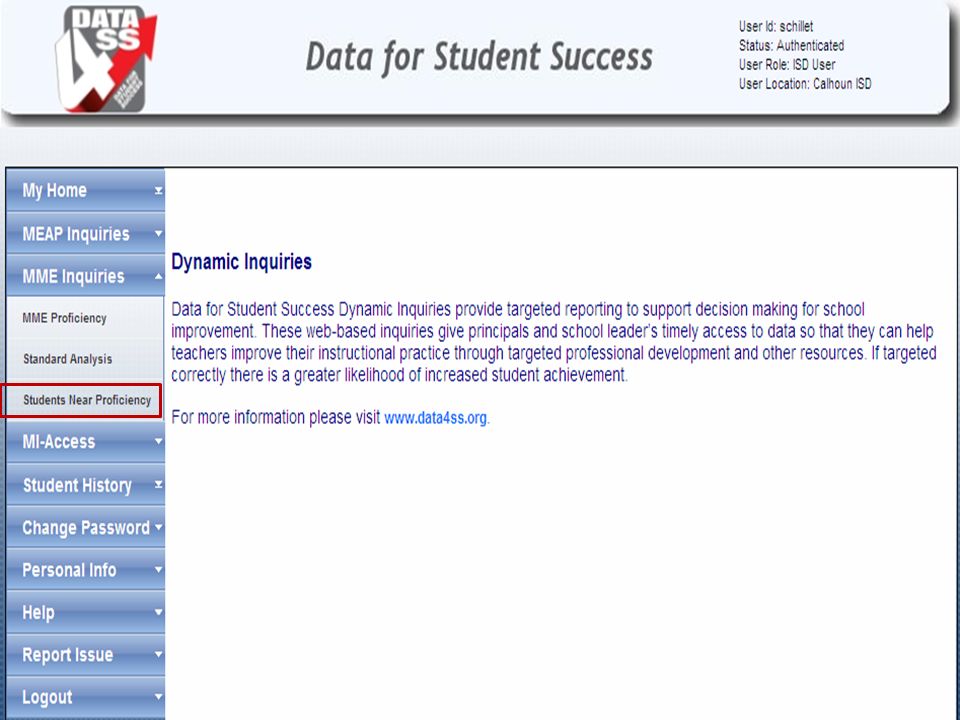
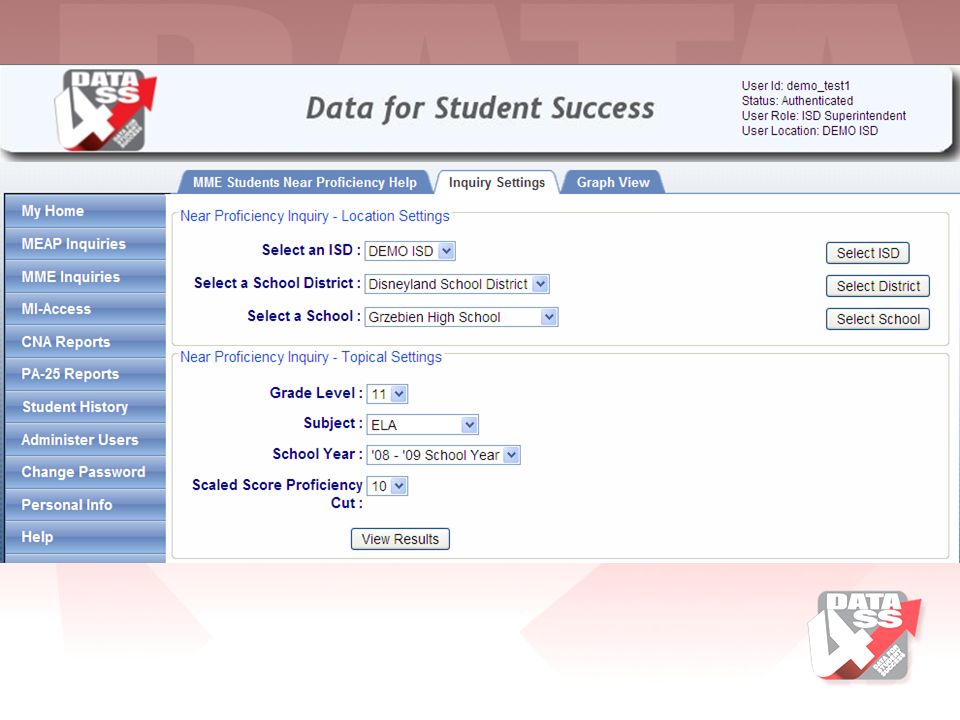
Accessing Demo Data www.data4ss.org Dynamic Inquiry Access Dynamic Inquiry Tool User Name: demo_test1 Password: fall_01 MME Standard Analysis 27

28
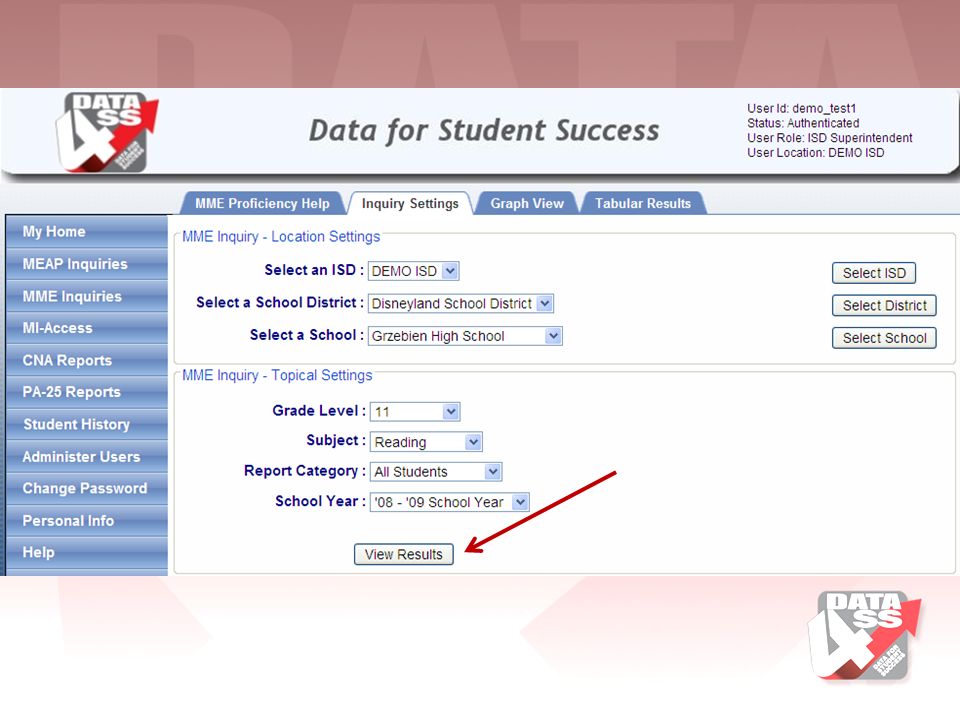
Navigation Process for Demo Site Select Inquiry Settings - tab Select Demo ISD Select Disneyland School District Select Grzebien High School Select 11 th grade Select Reading Select 2008-09 View Results 28

29
MME Standard Analysis 29

30
MME Blueprint for 2008-2009 30

31
MME Standard Analysis Main Graph Identifies points possible for each standard within a content area Identifies average number of points received by the state and the school in each standard assessed Identifies the Blueprint which shows the breakdown of points and percentage by standard for each content area

32
MME Reading Standard Analysis Spring 2009 32

33
33

34
What information does the detail graph provide? Identifies the state average number of points on the continuum of points available in the identified standard Identifies how our students performed on this standard in comparison to the state average. 34

35
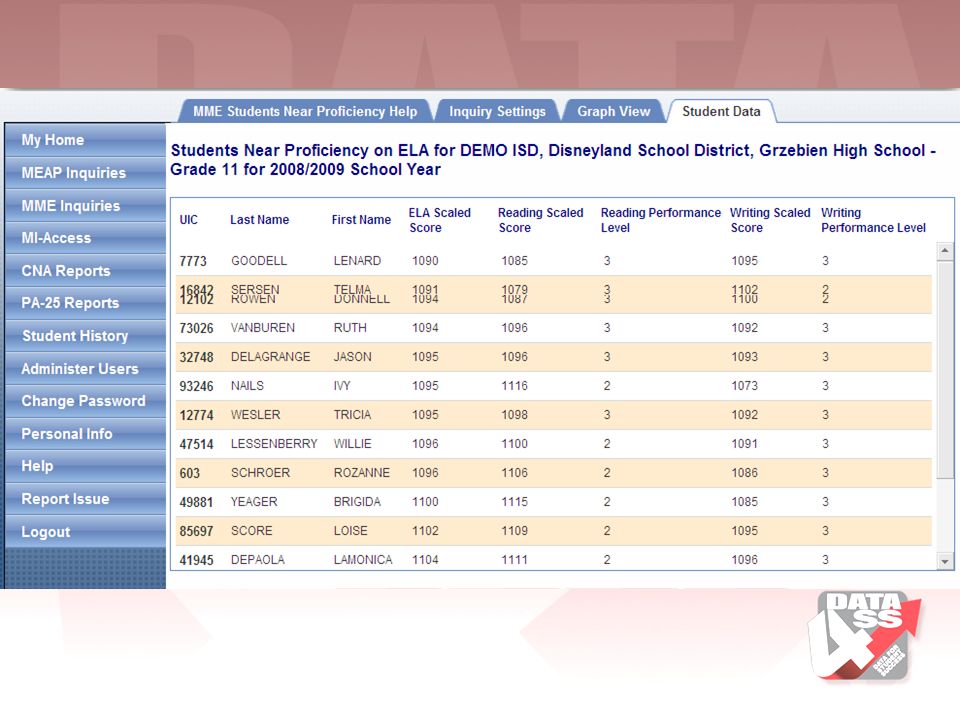
Student Data 35

36
What information does the student data provide? Identifies the students who scored in the same point range on a particular standard For each student the following is identified Scaled score Proficiency level for content area Maximum points in the standard Points scored Percent Correct 36

38
Data Narrative Statements… Are objective statements of FACT about the school data Represent student achievement, demographics, school programs, school processes, and stakeholder perceptions Communicate a SINGLE idea Are clear and concise – written in sentences or phrases Describe the data; they do not evaluate the data! MUST stand alone; they do not require the data source to accompany them in order to be understandable 38

39
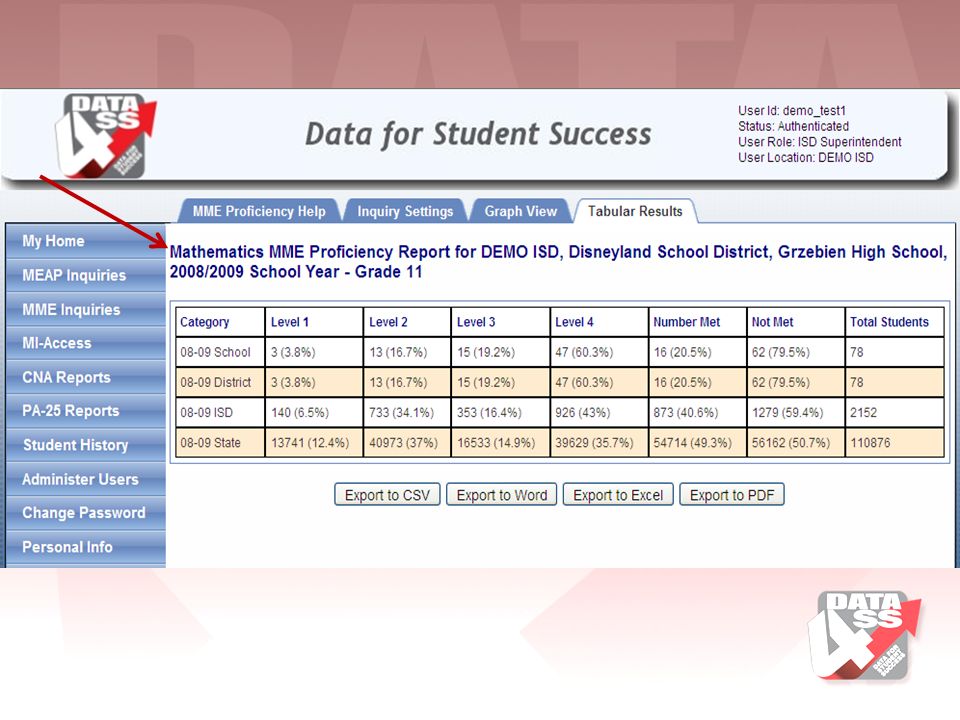
How might we use the Tabular results to write data narrative statements about our students?

40
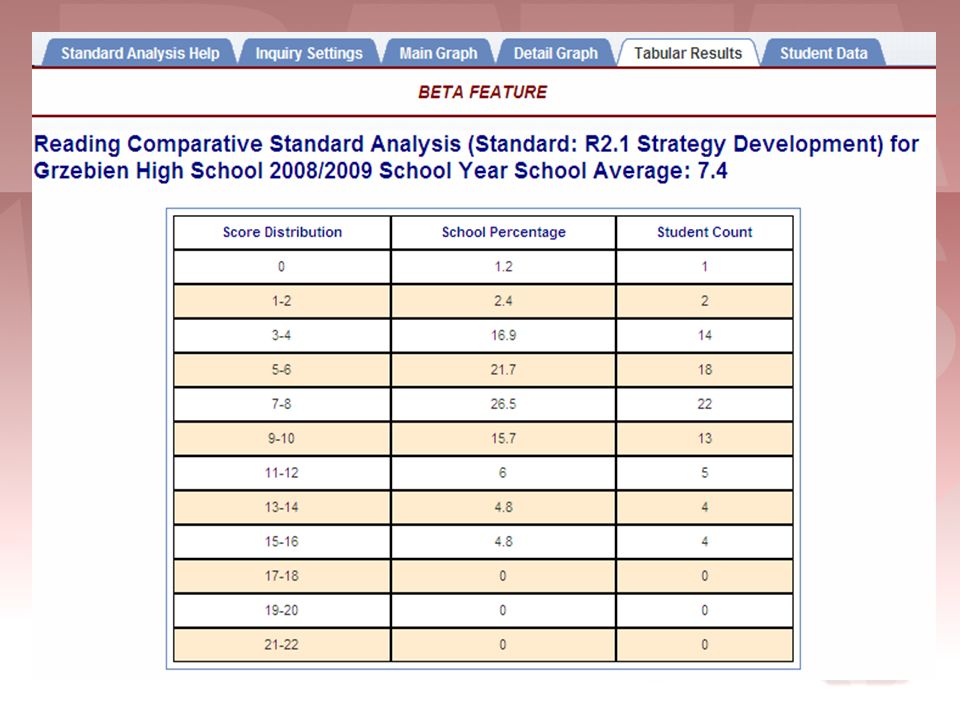
40 13 students scored equal to or more than half the points possible in this standard 16 % of our students scored equal to or more than half the points possible in this standard 70 Students scored less than half the points possible in this standard 84% of our students scored less than half the points possible in this standard

41
Standard Analysis Tabular Results

42
School – Data Dig MME Standard Analysis 2008-09 Complete data dig Access Data 4SS inquiry tool Focus on Reading and Math Templates MME Main Graph Tabular Results Reading Standard Analysis MME Math Standard Analysis Data Narrative Statements 42

43
Navigation Process Login Select Inquiries – MME Standard Analysis Select Inquiry Settings - tab Select ISD –Select District –Select School –Select Grade Level –Select Subject –Select School Year(s) View Results 43
 View Results 43")
44
Where do we go next?

45
45 13 students scored equal to or more than half the points possible in this standard 16 % of our students scored equal to or more than half the points possible in this standard 70 Students scored less than half the points possible in this standard 84% of our students scored less than half the points possible in this standard

46
Use of High School Content Expectation Document Find the Standard indicated on the MME Standard Analysis Blueprint Determine the Content Expectations contained within this standard Which Content Expectations are identified as Pre-MME? 46

47
Tabular Results for Standard 2.2 47

48
48 Expectations identified as Pre-MME by Standard

49
Now that we have identified the Content Expectations within the Standard what is our next question? What concepts and skills do students need to know and be able to do to be successful on these content expectations? 49

50
Where are these Content Expectations taught? –What courses? –What grades? How are these Content Expectations taught? –Do we use common instructional practices? –Are our practices effective? How are we going to assess these Content Expectations? –Do we use common assessments linked to these Content Expectations? –Do we analyze and use the results of our common assessments? 50

51
How do we know that students have learned these Content Expectations? What evidence will we collect? What are we going to do for the students that did not learn? What are we going to do for the students who have learned these expectations? 51

52
“High-quality classroom data clearly reflective of the students’ attainment of the most critical academic content – and available to educators routinely throughout the quarter/semester/year – are the data teachers need to be able to analyze in order to determine if students are indeed “hitting the target.” Common Formative Assessments by Larry Ainsworth and Donald Viegut, 2006 52

53
What do we know about our High School Students? The last state assessment is given in the beginning of the 8 th grade year for Math and Reading? How do we know what 9 th graders know as they come into high school? What data are we using to monitor student learning between 8 th grade and 11 th grade? 53

54
Assessing your Culture of Quality Data Assessment Inventory What does our school have in place? What data source are they using? Do they have: –long-term or summative data? –medium-term or formative/summative data? –short-term or formative data? In which content areas? Who uses all this data? 54

55
Assessing your Culture of Quality Data Assessment Inventory Activity Objectives Designed to inventory the sources of data used by individual schools. Enables schools to identify the dates data is collected, its audience, and how it is used. Provides schools an overall inventory of the sources of their data in a clear and concise chart. 55

56
Data Assessment Inventory State Assessment Level 56

57
Assessment Inventory Local Assessment Level 57

58
Assessing the Culture of Quality Data Using your school –What data do you collect? Use template to record what you currently know –What is in place? –Where do we need to go next? 58

59
QUESTIONS?

Similar presentations


 Title III Access to Core Professional.>")


