Download presentation
Presentation is loading. Please wait.

1
Revision Mid 2, Cache Prof. Sin-Min Lee Department of Computer Science

11
Implementing with a D AND a T flip-flop Using this FSM with three states, an operating only on inputs and transitions from one state to another, we will be using both D and T flip-flops.

12
Implementing with a D AND a T flip-flop Since we have no state “11”, our Q(t+1) is “don't care” = “XX” for both of these transitions. Consider the first column of the Q(t+1) values to be “D” and the second to be “T” and then we derive two corresponding charts. DT
 values to be D and the second to be T and then we derive two corresponding charts. DT.")
13
Implementing with a D AND a T flip-flop Then we need to derive the corresponding equations.

14
Implementing with a D AND a T flip-flop We assume that Q(t) is actually a pair of Q D Q T. Now, with these equations, we can graph the results.

15
Implementing with a D AND a T flip-flop

33
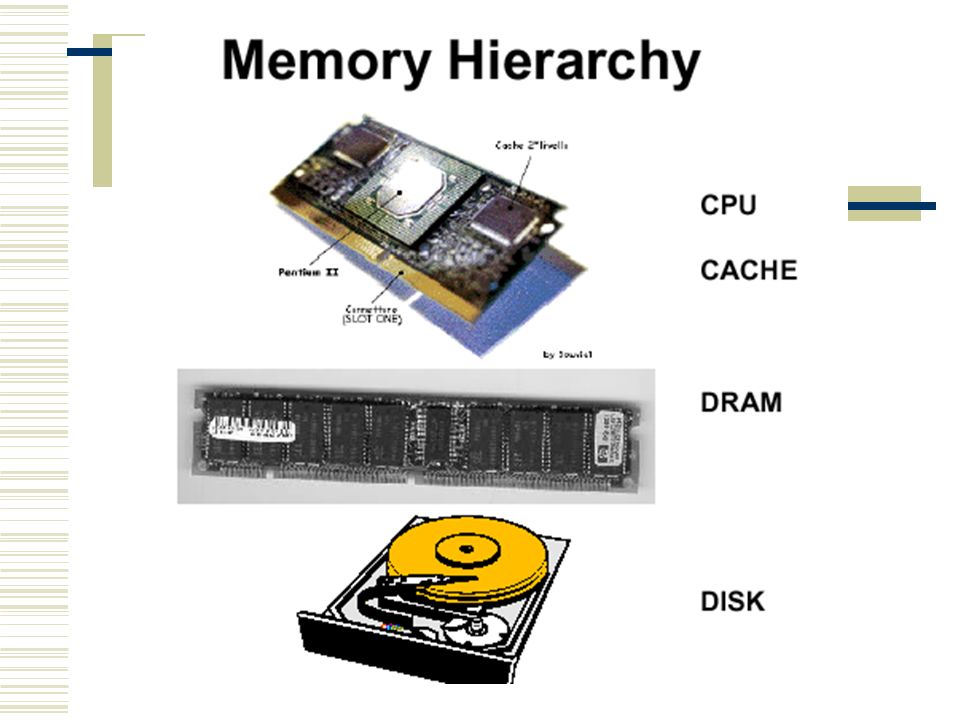
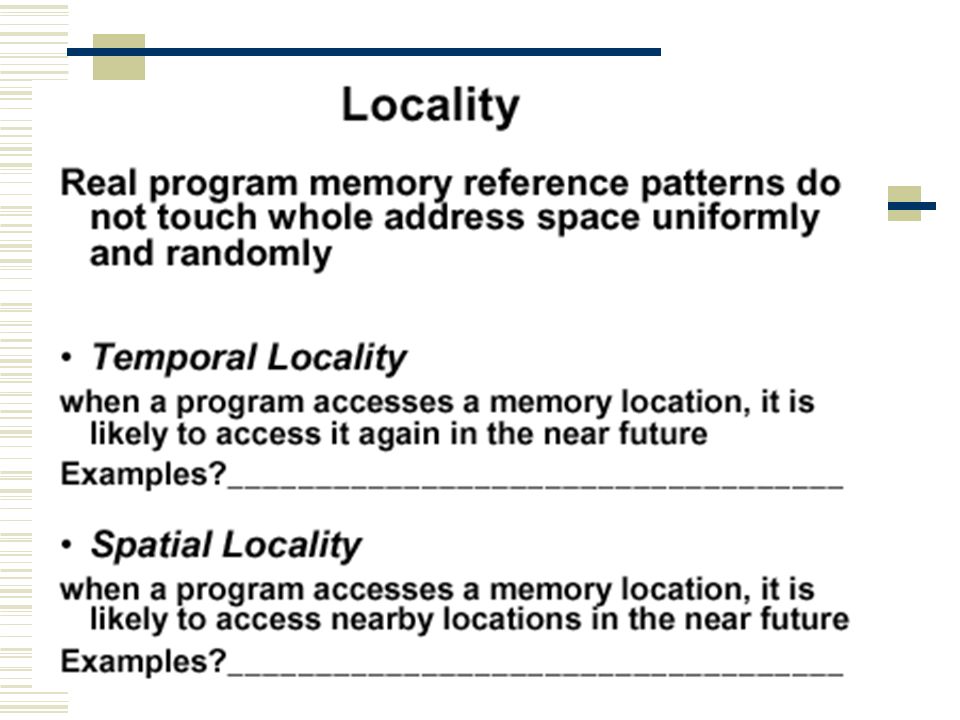
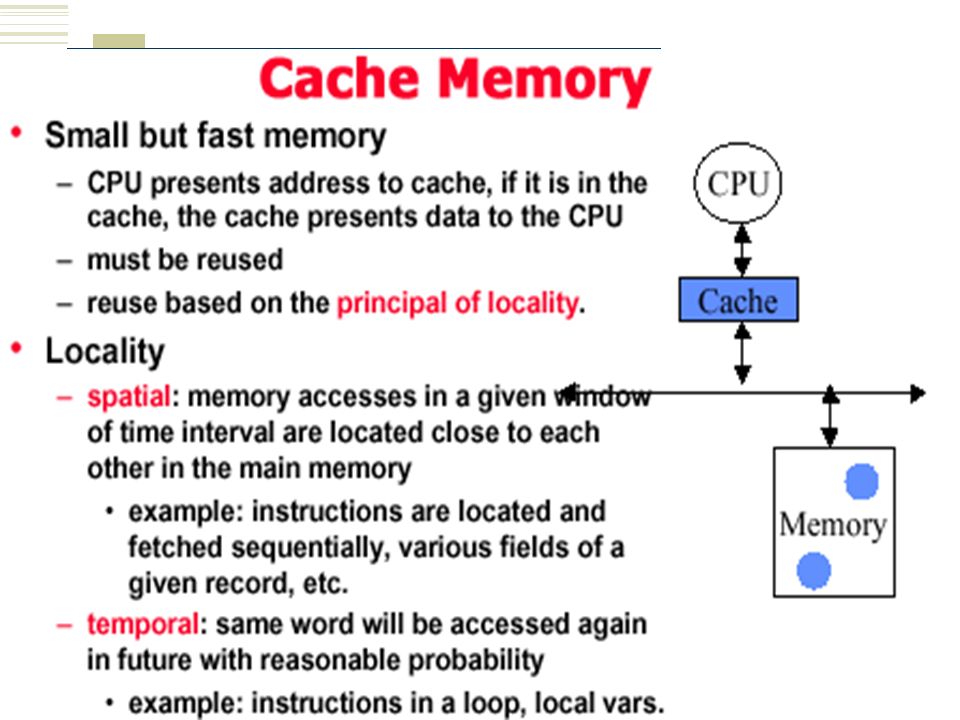
Memory Hierarchy Can only do useful work at the top 90-10 rule: 90% of time is spent of 10% of program Take advantage of locality temporal locality keep recently accessed memory locations in cache spatial locality keep memory locations nearby accessed memory locations in cache

38
The connection between the CPU and cache is very fast; the connection between the CPU and memory is slower

43
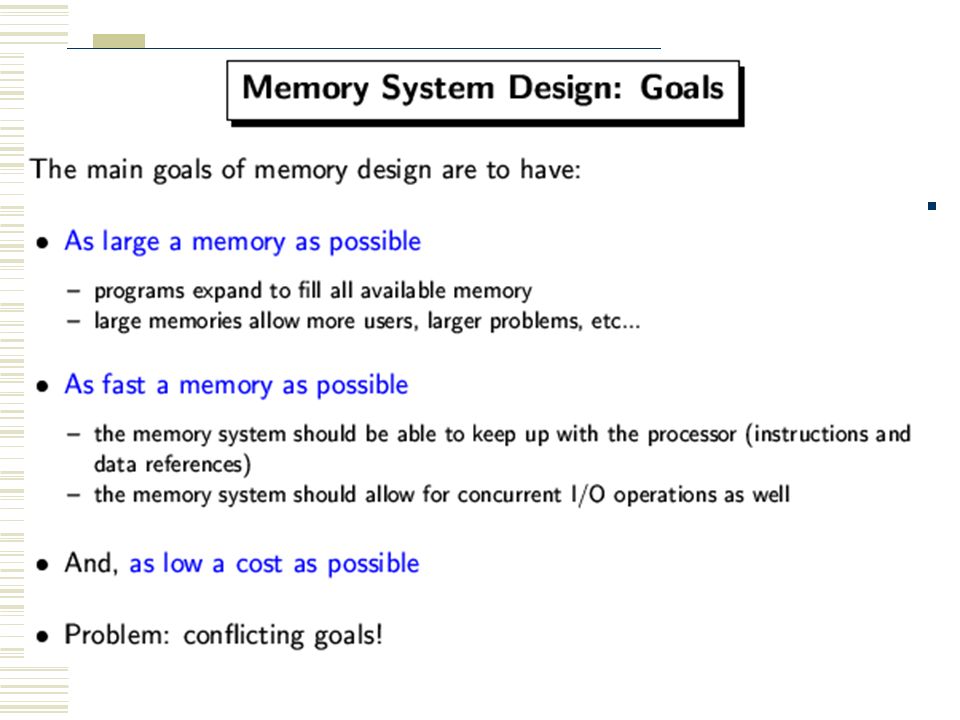
The Root of the Problem: Economics Fast memory is possible, but to run at full speed, it needs to be located on the same chip as the CPU Very expensive Limits the size of the memory Do we choose: A small amount of fast memory? A large amount of slow memory?

44
Memory Hierarchy Design (1) Since 1987, microprocessors performance improved 55% per year and 35% until 1987 This picture shows the CPU performance against memory access time improvements over the years Clearly there is a processor-memory performance gap that computer architects must take care of
 Since 1987, microprocessors performance improved 55% per year and 35% until 1987 This picture shows the CPU performance against memory access time improvements over the years Clearly there is a processor-memory performance gap that computer architects must take care of")
45
Memory Hierarchy Design (1) Since 1987, microprocessors performance improved 55% per year and 35% until 1987 This picture shows the CPU performance against memory access time improvements over the years Clearly there is a processor-memory performance gap that computer architects must take care of
 Since 1987, microprocessors performance improved 55% per year and 35% until 1987 This picture shows the CPU performance against memory access time improvements over the years Clearly there is a processor-memory performance gap that computer architects must take care of")
46
The Root of the Problem: Economics Fast memory is possible, but to run at full speed, it needs to be located on the same chip as the CPU Very expensive Limits the size of the memory Do we choose: A small amount of fast memory? A large amount of slow memory?

47
Memory Hierarchy Design (1) Since 1987, microprocessors performance improved 55% per year and 35% until 1987 This picture shows the CPU performance against memory access time improvements over the years Clearly there is a processor-memory performance gap that computer architects must take care of
 Since 1987, microprocessors performance improved 55% per year and 35% until 1987 This picture shows the CPU performance against memory access time improvements over the years Clearly there is a processor-memory performance gap that computer architects must take care of")
48
Memory Hierarchy Design (1) Since 1987, microprocessors performance improved 55% per year and 35% until 1987 This picture shows the CPU performance against memory access time improvements over the years Clearly there is a processor-memory performance gap that computer architects must take care of
 Since 1987, microprocessors performance improved 55% per year and 35% until 1987 This picture shows the CPU performance against memory access time improvements over the years Clearly there is a processor-memory performance gap that computer architects must take care of")
49
The Cache Hit Ratio How often is a word found in the cache? Suppose a word is accessed k times in a short interval 1 reference to main memory (k-1) references to the cache The cache hit ratio h is then
 references to the cache The cache hit ratio h is then.")
50
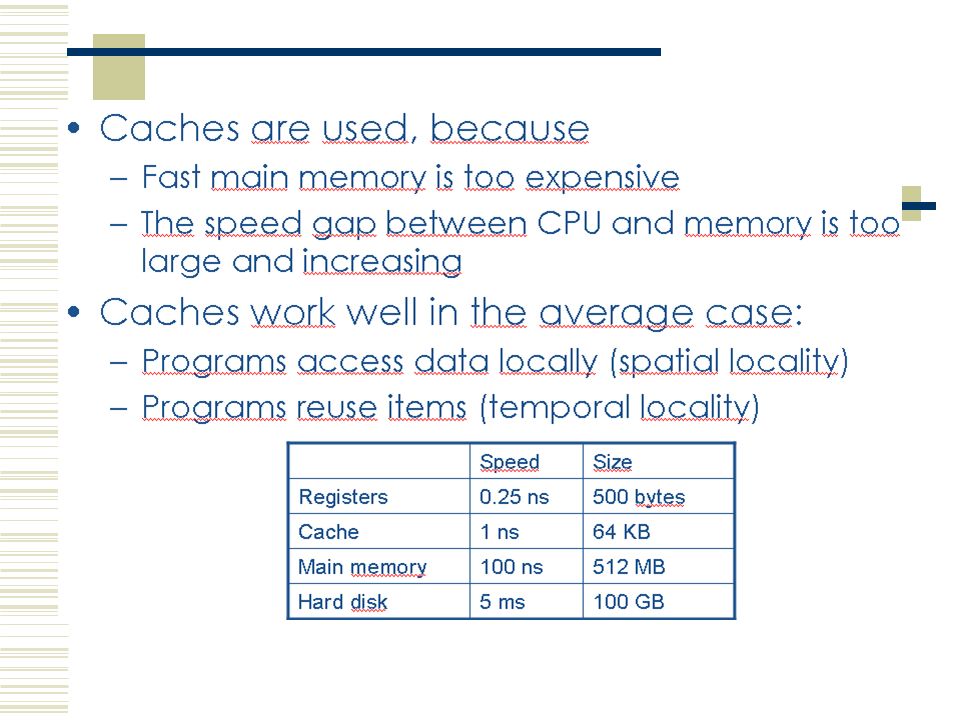
Reasons why we use cache Cache memory is made of STATIC RAM – a transistor based RAM that has very low access times (fast) STATIC RAM is however, very bulky and very expensive Main Memory is made of DYNAMIC RAM – a capacitor based RAM that has very high access times because it has to be constantly refreshed (slow) DYNAMIC RAM is much smaller and cheaper
 STATIC RAM is however, very bulky and very expensive Main Memory is made of DYNAMIC RAM – a capacitor based RAM that has very high access times because it has to be constantly refreshed (slow) DYNAMIC RAM is much smaller and cheaper")
51
Performance (Speed) Access time Time between presenting the address and getting the valid data (memory or other storage) Memory cycle time Some time may be required for the memory to “recover” before next access cycle time = access + recovery Transfer rate rate at which data can be moved for random access memory = 1 / cycle time (cycle time) -1
 Access time Time between presenting the address and getting the valid data (memory or other storage) Memory cycle time Some time may be required for the memory to recover before next access cycle time = access + recovery Transfer rate rate at which data can be moved for random access memory = 1 / cycle time (cycle time) -1")
58
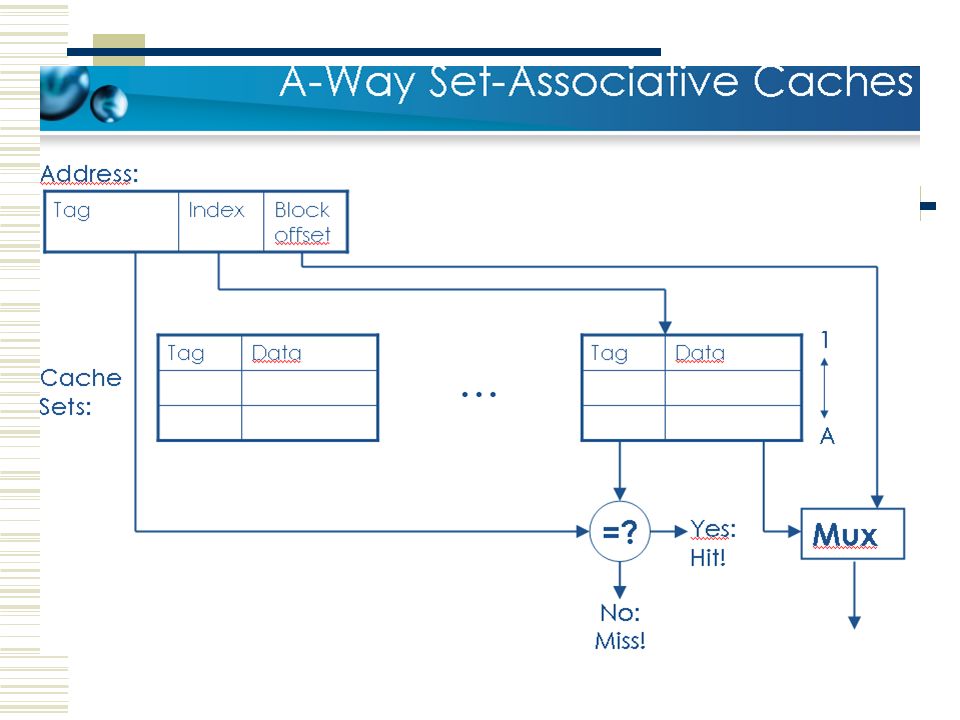
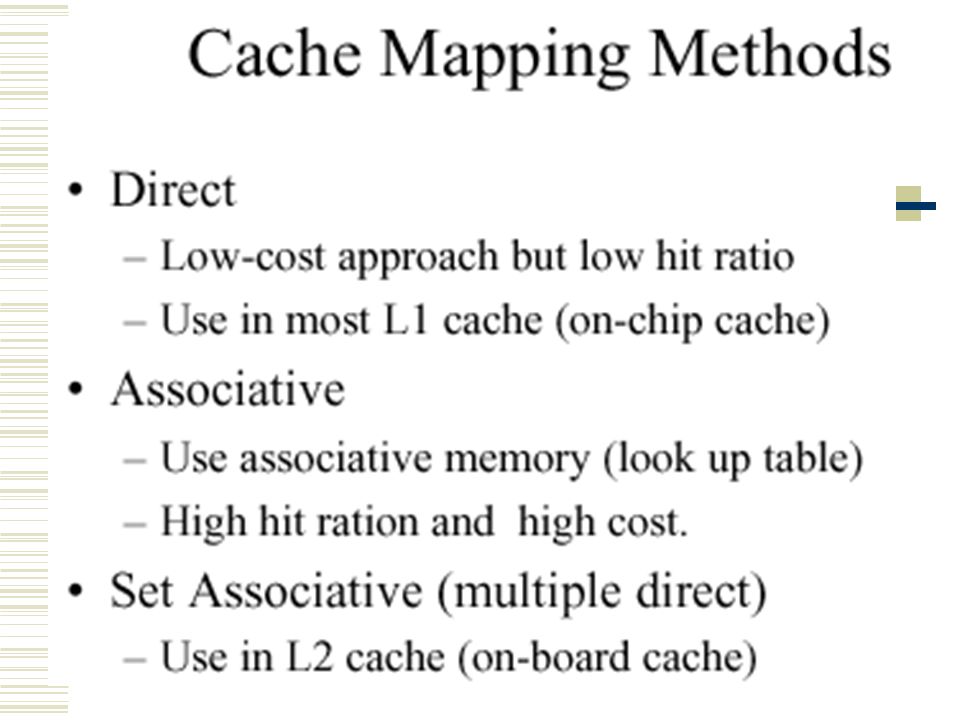
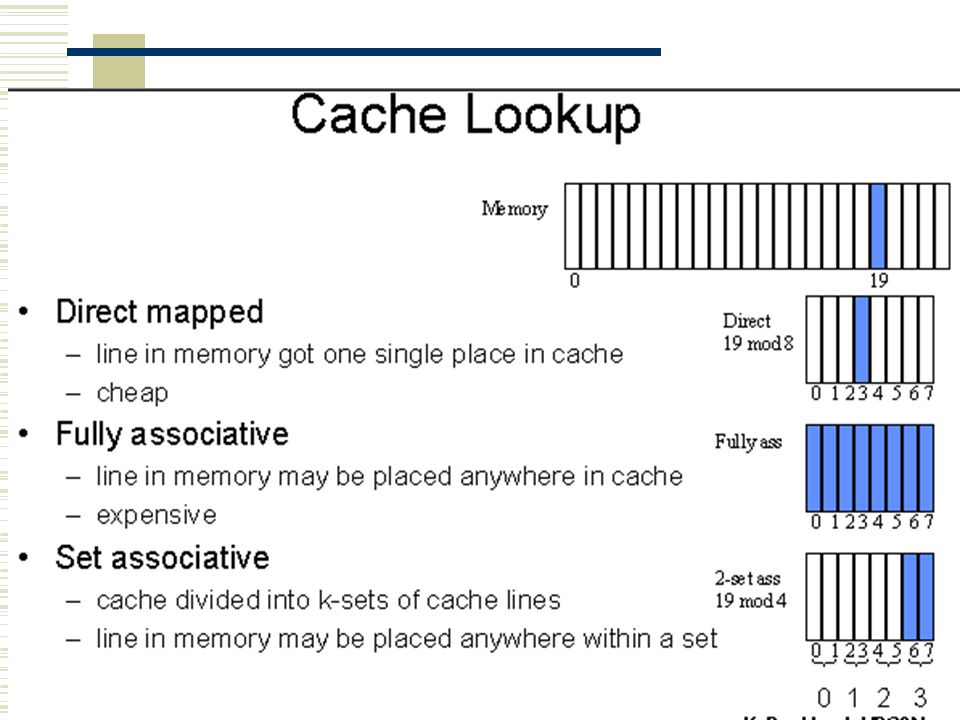
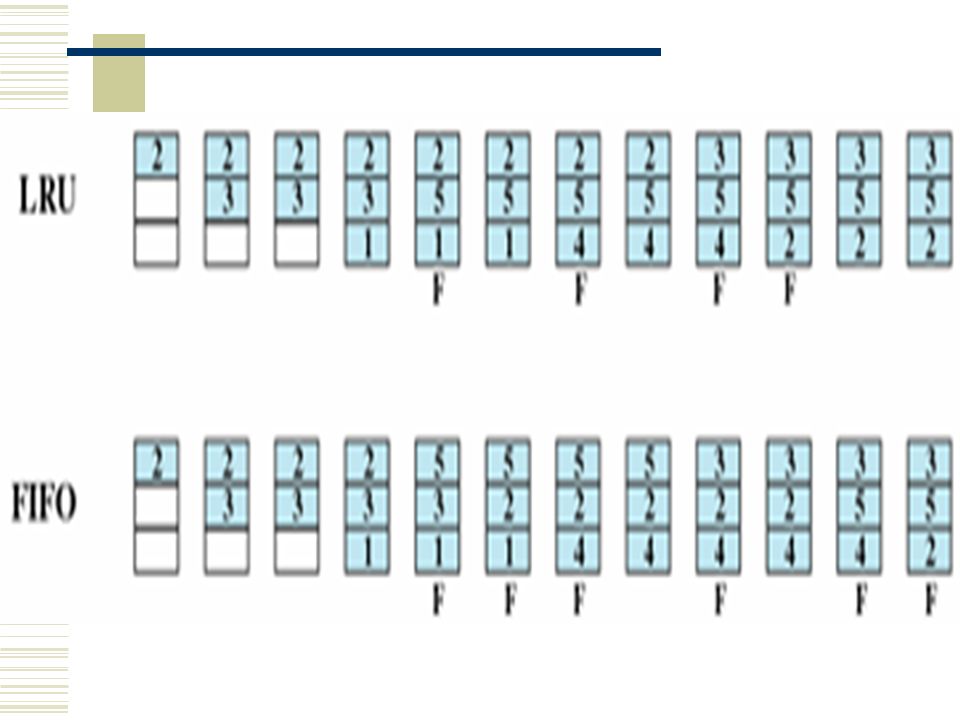
Comparison of Placement Algorithms

Similar presentations


 Logical Memory Map. Each location size is one byte (Byte Addressable)>")


 Organization.>")

 –Objectives in Memory Design –Memory Types –Memory Hierarchies Memory Management (Software.>")


