Download presentation
Presentation is loading. Please wait.

1
Benchmarking in European Service of public Transport Results of the 2007 survey

2
BEST Survey 2007 2 Content About the survey Participants Sample Method Questionnaire Results (graphs) How to read the graphs? Each quality dimension Background information

3
BEST Survey 2007 3 About the survey The following cities participated in the BEST 2007 survey: Stockholm (Extended questionnaire) Oslo (Extended questionnaire) Helsinki (Extended questionnaire, with additional questions) Copenhagen (Extended questionnaire, with additional questions) Vienna (Extended questionnaire) Berlin (Extended questionnaire) Prague (Extended questionnaire) Geneva (Extended questionnaire) – Fieldwork in august/september 2007 For all cities 1000 residents in defined areas have been interviewed. The exception is Helsinki where 150 additional interviews where performed in the Espoo area. All interviews have been done by telephone. The fieldwork for BEST Survey 2007 was conducted between March 5th and March 18th 2007. Results from the survey have been weighted with respect to sex and age to match the profile in each area. The Helsinki results are weighted with respect to geography as well, to correct for the uneven distribution of interviews resulting from the extra interviews in Espoo. All 1150 interviews in Helsinki are included in the analysis. The questionnaire used in the survey is an updated version of the 2006 questionnaire. Since 2006 one new statement (‘The information is good in stops and terminals’) and two new background questions (‘region/geography’ and ‘usage of different modes of public transport’) have been added. In Copenhagen the question on ‘usage of PT modes’ have been formulated differently. In Copenhagen respondents were asked how often they used each transport mode. For reporting and comparison purposes these questions have been recoded as follows: If a respondent states that he/she travels with PT on a daily basis, all transport modes which this respondent use on a daily basis is coded as ‘generally uses’. Transport modes who are not used on a daily basis have for this respondent been coded as ‘not used generally’. Response rate Stockholm64 % Oslo28 % Helsinki32 % Copenhagen40 % Vienna54 % Geneva56 % Berlin33 % Prague31 %
 and two new background questions (‘region/geography’ and ‘usage of different modes of public transport’) have been added. In Copenhagen the question on ‘usage of PT modes’ have been formulated differently. In Copenhagen respondents were asked how often they used each transport mode. For reporting and comparison purposes these questions have been recoded as follows: If a respondent states that he/she travels with PT on a daily basis, all transport modes which this respondent use on a daily basis is coded as ‘generally uses’. Transport modes who are not used on a daily basis have for this respondent been coded as ‘not used generally’. Response rate Stockholm64 % Oslo28 % Helsinki32 % Copenhagen40 % Vienna54 % Geneva56 % Berlin33 % Prague31 %.")
4
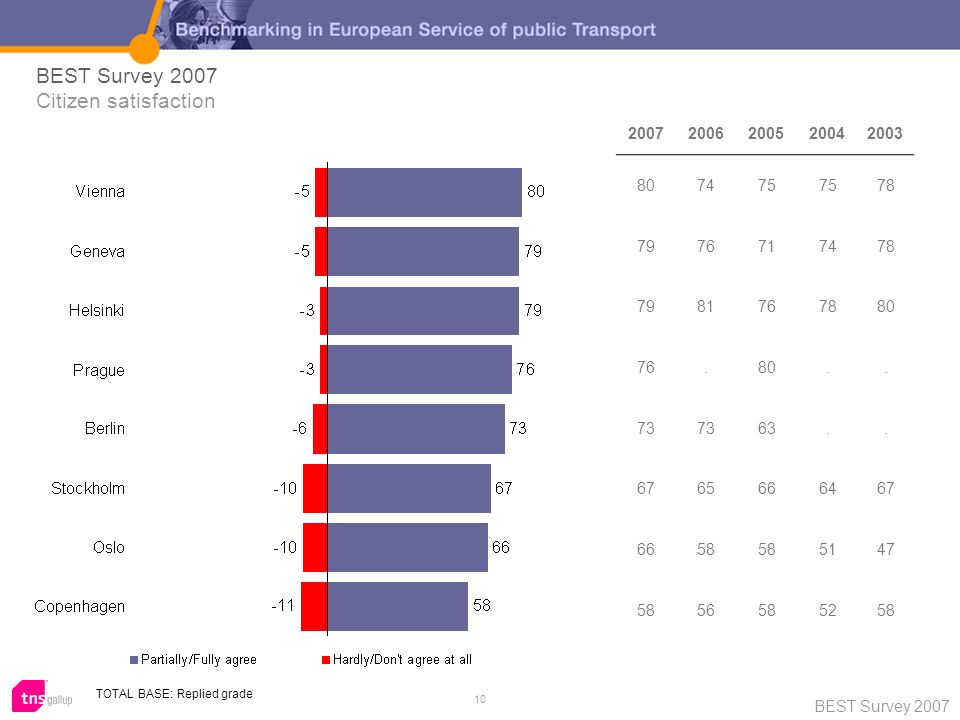
BEST Survey 2007 4 How to read the graphs The graphs show the proportion of the respondents who agrees (partially agrees or fully agrees) to the different statements in blue columns. The red columns shows the proportion who disagrees (hardly agrees or not agree at all) to the statements. Respondents with a neutral position are not displayed in the graphs. The graphs also include results from previous surveys, shown in the table to the right as the proportion of the respondents who agrees to the statement in question. Development per index in the different cities are also shown as time lines. All graphs are standard PowerPoint-graphs where different categories can be hidden and value labels displayed at ones own preference.
 to the statements. Respondents with a neutral position are not displayed in the graphs. The graphs also include results from previous surveys, shown in the table to the right as the proportion of the respondents who agrees to the statement in question. Development per index in the different cities are also shown as time lines. All graphs are standard PowerPoint-graphs where different categories can be hidden and value labels displayed at ones own preference..")
5
Overall report – BEST Survey Results 2007

6
BEST Survey 2007 6 BEST Survey 2007 Best performing city per index TOTAL BASE: Replied grade

7
BEST Survey 2007 7 BEST Survey 2006 Best performing city per index TOTAL BASE: Replied grade

8
BEST Survey 2007 8 BEST Survey 2005 Best performing city per index TOTAL BASE: Replied grade

9
BEST Survey 2007 Citizen satisfaction

10
BEST Survey 2007 10 BEST Survey 2007 Citizen satisfaction TOTAL BASE: Replied grade 20072006200520042003 807475 78 7976717478 7981767880 76.80.. 73 63.. 6765666467 6658 5147 5856585258
11
BEST Survey 2007 11 Citizen satisfaction TOTAL BASE: Replied grade % satisfied citizens

12
BEST Survey 2007 Traffic supply

13
BEST Survey 2007 13 BEST Survey 2007 Traffic supply 20072006200520042003 847065.. 726667 70 6968676467 69.73.. 66676567 6255575553 58576260 5756555457 TOTAL BASE: Replied grade

14
BEST Survey 2007 14 All cities Traffic supply TOTAL BASE: Replied grade % satisfied citizens

15
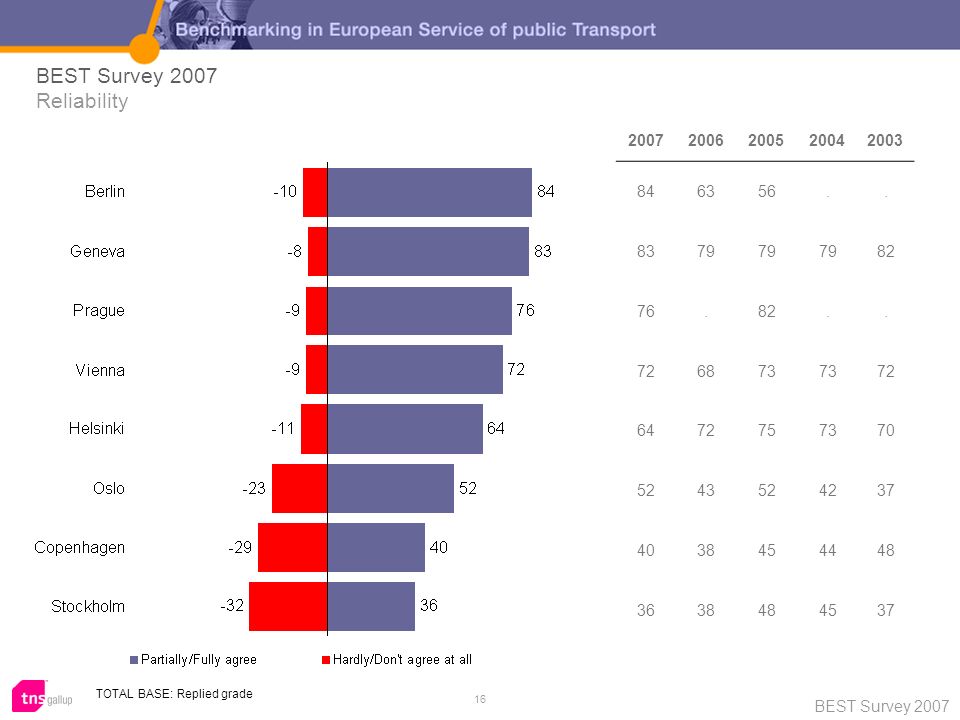
BEST Survey 2007 Reliability

16
BEST Survey 2007 16 BEST Survey 2007 Reliability TOTAL BASE: Replied grade 20072006200520042003 846356.. 8379 82 76.82.. 726873 72 6472757370 5243524237 4038454448 3638484537
17
BEST Survey 2007 17 All cities Reliability TOTAL BASE: Replied grade % satisfied citizens

18
BEST Survey 2007 Information

19
BEST Survey 2007 19 BEST Survey 2007 Information 20072006200520042003 7166646968 674746.. 64545856 63... 4951 5048 57525049 4742444339 4348535052 TOTAL BASE: Replied grade

20
BEST Survey 2007 20 All cities Information TOTAL BASE: Replied grade % satisfied citizens

21
BEST Survey 2007 Staff behaviour

22
BEST Survey 2007 22 BEST Survey 2007 Staff behaviour 20072006200520042003 7576727678 7465676967 71676467 715657.. 6665 6369 63.65.. 5759565760 5559636163 TOTAL BASE: Replied grade

23
BEST Survey 2007 23 All cities Staff behaviour TOTAL BASE: Replied grade % satisfied citizens

24
BEST Survey 2007 Security and safety

25
BEST Survey 2007 25 BEST Survey 2007 Security and safety 20072006200520042003 8781 8286 8380 7975 8074727577 725561.. 7172 73 70 6570 6563656069 58.62.. TOTAL BASE: Replied grade

26
BEST Survey 2007 26 All cities Security and safety TOTAL BASE: Replied grade % satisfied citizens

27
BEST Survey 2007 Comfort

28
BEST Survey 2007 28 BEST Survey 2007 Comfort 20072006200520042003 775857.. 7167666568 696465 68 63 64 65 5553555756 54 5855 5448495147 50.55.. TOTAL BASE: Replied grade

29
BEST Survey 2007 29 All cities Comfort TOTAL BASE: Replied grade % satisfied citizens

30
BEST Survey 2007 Social image

31
BEST Survey 2007 31 BEST Survey 2007 Social image 20072006200520042003 8981827876 8785808285 8682818283 85818280 7470.. 8081787681 80.79.. 7068676166 TOTAL BASE: Replied grade

32
BEST Survey 2007 32 All cities Social image TOTAL BASE: Replied grade % satisfied citizens

33
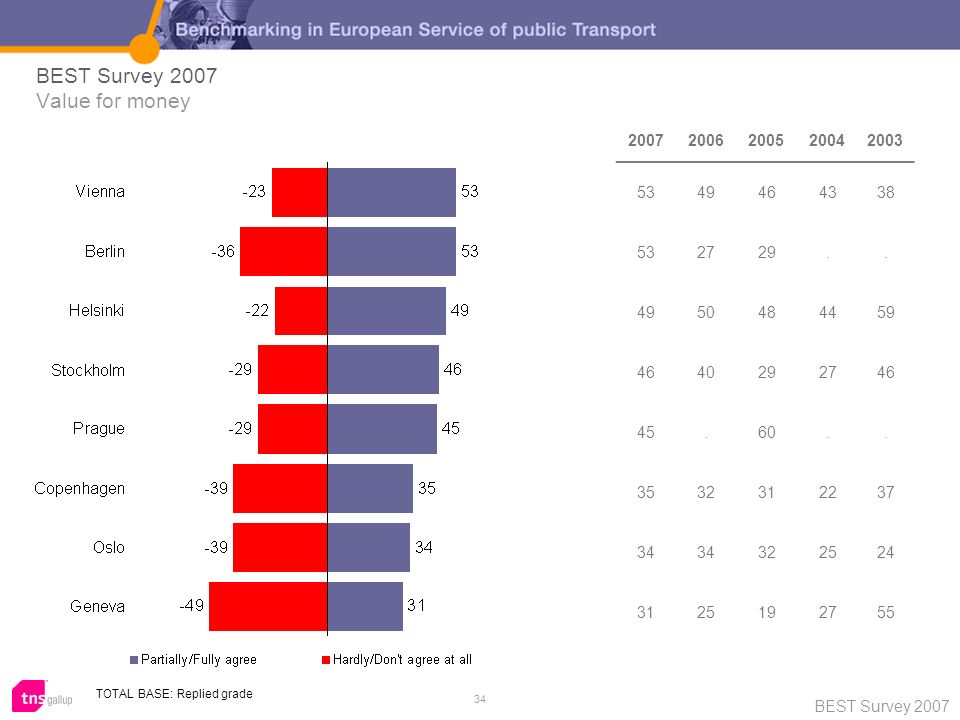
BEST Survey 2007 Value for money

34
BEST Survey 2007 34 BEST Survey 2007 Value for money TOTAL BASE: Replied grade 20072006200520042003 5349464338 532729.. 4950484459 4640292746 45.60.. 3532312237 34 322524 3125192755
35
BEST Survey 2007 35 All cities Value for money TOTAL BASE: Replied grade % satisfied citizens

36
Loyalty BEST Survey 2007

37
37 BEST Survey 2007 Loyalty 20072006200520042003 8175797479 78.77.. 787576 79 7567636271 5852.. 6553575348 6157 5561 4945 3946 TOTAL BASE: Replied grade

38
BEST Survey 2007 38 All cities Loyalty TOTAL BASE: Replied grade % satisfied citizens

39
Background information BEST Survey 2007

40
40 Gender – All cities 2007

41
BEST Survey 2007 41 Age – All cities 2007

42
BEST Survey 2007 42 Life situation – All cities 2007

43
BEST Survey 2007 43 PT travel frequency – All cities 2007

44
Further information and other available reports at best2005.net

Similar presentations


