Download presentation
Presentation is loading. Please wait.

1
CLOSING THE GAPS – REDUCING INEQUALITIES IN EDUCATIONAL OUTCOMES BIRMINGHAM ACHIEVEMENT GROUP SEMINAR JANUARY 2007 JOHN HILL RESEARCH& STATISTICS

2
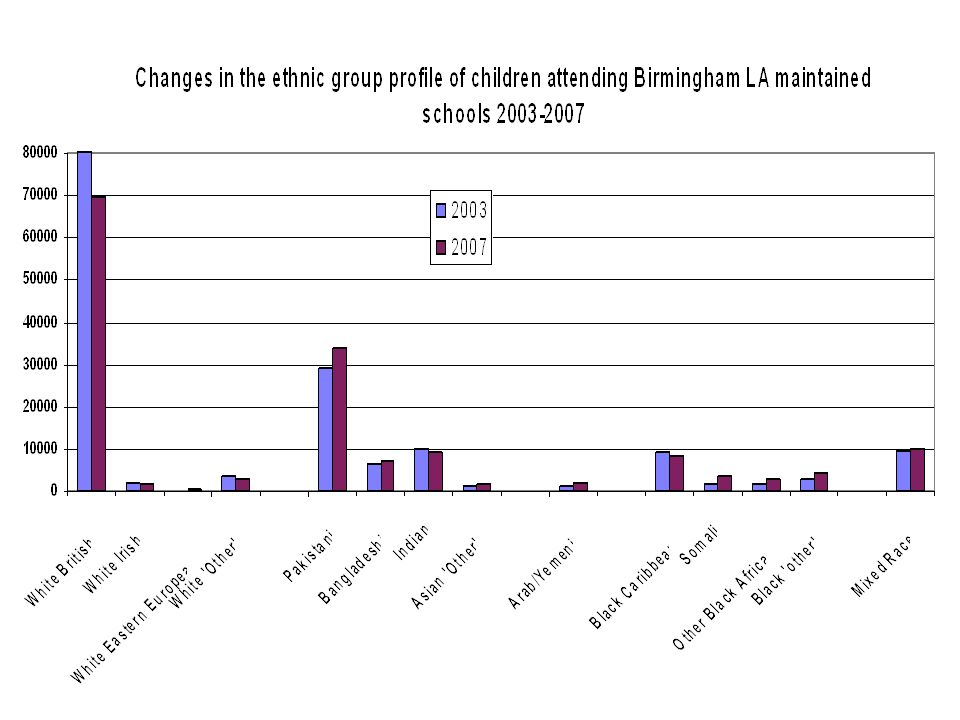
Groups at risk of underachieving Analysis of educational performance data in Birmingham identified inequalities in educational outcomes for some pupil groups. In particular: –African Caribbean children –White/Black Caribbean children –Bangladeshi children –Pakistani children –Children from disadvantaged backgrounds. –Looked after children –Children with disabilities/special needs Boys performance is generally below that of girls at each Key Stage. Changes in the City’s demographics, particularly new and emerging communities, mean that groups at risk of underachieving are not static. The City’s achievement programmes were set-up to raise standards and reduce these inequalities.

3
Further Information Birmingham’s Examination and Assessment Results 2007 From: www.bgfl.org/performwww.bgfl.org/perform In LA Data, LA Standards

9
Comparison of ethnic group profile of current Y10 pupils and current Reception Year Pupils

12
Black Caribbean Pupil Density Map

13
Pakistani Pupil Density Map

14
White – Eligible for FSM Pupil Density Map

15
Primary schools with highest percentages of: Pakistani pupilsBangladeshi PupilsAfrican Caribbean NANSEN91% ANGLESEY54% ST GEORGE'S CE(B19)67% MONTGOMERY89% PRINCE ALBERT49% SACRED HEART65% SHAW HILL88% ASTON TOWER44% CROMWELL62% CITY ROAD86% MANSFIELD GREEN39% WILLIAM COWPER59% ANDERTON PARK85% YEW TREE35% ST PATRICK'S RC(B18)59% MARLBOROUGH85% HEATHFIELD34% NELSON59% MARLBOROUGH82% ST BENEDICT'S30% FOUNDRY56% GREET82% ST THOMAS'53% SPRINGFIELD79% ST JOHN'S CE(B16)52% BORDESLEY GREEN78% ST FRANCIS RC51% ARDEN(NC)77% HOLY TRINITY CE50%
67% MONTGOMERY89% PRINCE ALBERT49% SACRED HEART65% SHAW HILL88% ASTON TOWER44% CROMWELL62% CITY ROAD86% MANSFIELD GREEN39% WILLIAM COWPER59% ANDERTON PARK85% YEW TREE35% ST PATRICK S RC(B18)59% MARLBOROUGH85% HEATHFIELD34% NELSON59% MARLBOROUGH82% ST BENEDICT S30% FOUNDRY56% GREET82% ST THOMAS 53% SPRINGFIELD79% ST JOHN S CE(B16)52% BORDESLEY GREEN78% ST FRANCIS RC51% ARDEN(NC)77% HOLY TRINITY CE50%")
16
Secondary schools with highest percentages of: Pakistani pupils BORDESLEY GREEN GIRLS85% AL-HIJRAH76% PARK VIEW72% SMALL HEATH72% HODGE HILL GIRLS69% MOSELEY66% SALTLEY65% WASHWOOD HEATH61% GOLDEN HILLOCK57% WAVERLEY53% SELLY PARK50% Bangladeshi BROADWAY33% HOLTE33% GOLDEN HILLOCK23% African Caribbean GEORGE DIXON INTERNATIONAL46% ASTON MANOR42% THE HEARTLANDS HIGH34% ST JOHN WALL RC32% ST ALBAN'S CE32% HILLCREST28% HARBORNE HILL28% HANDSWORTH WOOD GIRLS24% HAMSTEAD HALL23% HOLY TRINITY RC22% LORDSWOOD BOYS22% HOLYHEAD20% FOUR DWELLINGS20%

17
ATTAINMENT TRENDS AT EACH KEY STAGE

41
SUMMARY Compared to the national average, attainment on entry to school in Birmingham is much lower. Significantly more children in Birmingham have English as an additional language and significantly more children in Birmingham are economically disadvantaged. These factors represent real challenges to raising achievement. There is evidence to show that the achievement gaps are closing, although not yet consistently across each Key Stage. Gaps remain wide in the early years. Most improvements have been made at Key Stage 4 where all groups have improved at a rate that is nearly twice the national average. For example, between 2002-2007: Black Caribbean boys’ 5A*-C results have improved by 25% (5A*-C with E&M by 12%) Black Caribbean girls’ results have improved by 19%(5A*-C with E&M by 13%) Bangladeshi boys’ results have improved by 15% (5A*-C with E&M by 5%) Bangladesh girls’ results have improved by 12% (5A*-C with E&M by 10%) Pakistani boys’ results have improved by 18% (5A*-C with E&M by 11%) Pakistani girls’ results have improved by 17% (5A*-C with E&M by 10%) White boy’s on fsm results have improved by 15% (5A*-C with E&M by 5%) White girl’s on fsm results have improved by 20% (5A*-C with E&M by 7%) This compares to a national average improvement rate over this period of 11% for 5A*- C and 5% for 5A*-C with E&M and a Birmingham average improvement rate of 17% for 5A*-C and 9% for 5A*-C with E&M. While these improvements are not sufficient to close the gaps completely, they do represent significant progress
 Black Caribbean girls’ results have improved by 19%(5A*-C with E&M by 13%) Bangladeshi boys’ results have improved by 15% (5A*-C with E&M by 5%) Bangladesh girls’ results have improved by 12% (5A*-C with E&M by 10%) Pakistani boys’ results have improved by 18% (5A*-C with E&M by 11%) Pakistani girls’ results have improved by 17% (5A*-C with E&M by 10%) White boy’s on fsm results have improved by 15% (5A*-C with E&M by 5%) White girl’s on fsm results have improved by 20% (5A*-C with E&M by 7%) This compares to a national average improvement rate over this period of 11% for 5A*- C and 5% for 5A*-C with E&M and a Birmingham average improvement rate of 17% for 5A*-C and 9% for 5A*-C with E&M. While these improvements are not sufficient to close the gaps completely, they do represent significant progress.")
Similar presentations


>")


