Download presentation
Presentation is loading. Please wait.

1
CHAPTER VI BLOCK DIAGRAMS AND LINEARIZATION
Process Control CHAPTER VI BLOCK DIAGRAMS AND LINEARIZATION

2
Example: Consider the stirred tank blending process. X1, w1 X2, w2 I/P
AT AC xsp X, w1

3
Control objective: regulate the tank composition x, by adjusting w2.
Disturbance variable: inlet composition x1 Assumptions: w1 is constant System is initially at steady-state Both feed and output compositions are dilute Feed flow rate is constant Stream 2 is pure material

4
Process

7
Measuring Element Assume that the dynamic behavior of the composition sensor-transmitter can be approximated by a first-order transfer function; when, can be assumed to be equal to zero.

8
Controller proportional proportional-integral proportional-derivative
proportional-derivative-integral

9
Current to pressure (I/P) transducer
Assuming a linear transducer with a constant steady state gain KIP.

10
Assuming a first-order behavior for the valve gives;
Control Valve Assuming a first-order behavior for the valve gives;

11
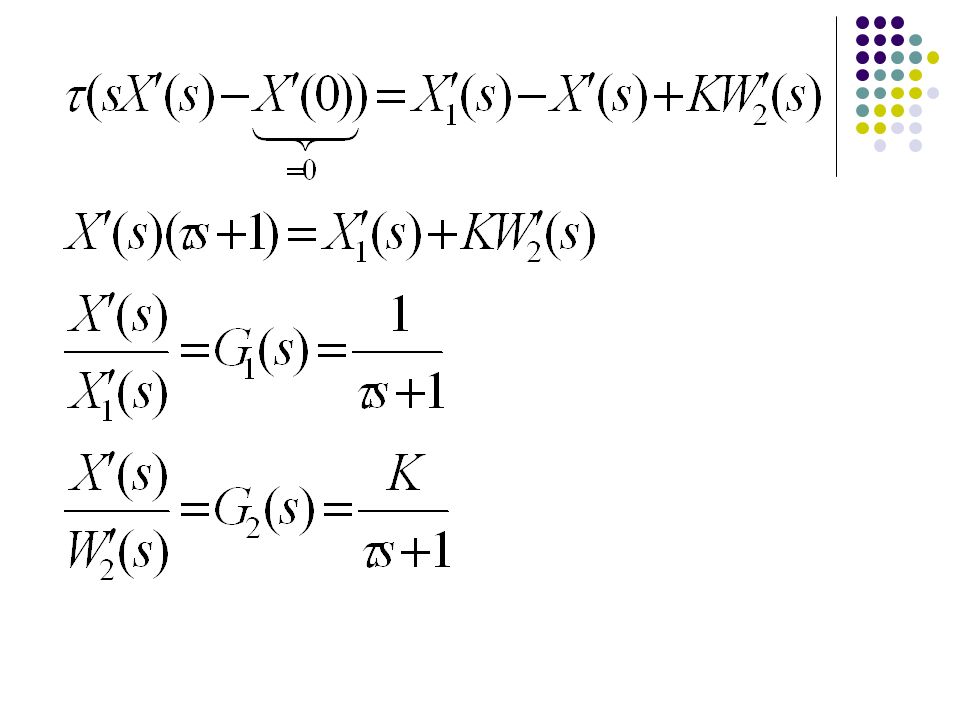
Change in exit composition due to change in inlet composition X´1(s)
Change in exit composition due to a change in inlet composition W´2(s) Set-point composition (mass fraction) Set-point composition as an equivalent electrical current signal
 Set-point composition (mass fraction) Set-point composition as an equivalent electrical current signal.")
13
Linearization A major difficulty in analyzing the dynamic response of many processes is that they are nonlinear, that is, they can not be represented by linear differential equations. The method of Laplace transforms allows us to relate the response characteristics of a wide variety of physical systems to the parameters of their transfer functions. Unfortunately, only linear systems can be analyzed by Laplace Transforms.

14
Linearization is a technique used to approximate the response of non linear systems with linear differential equations that can than be analyzed by Laplace transforms. The linear approximation to the non linear equations is valid for a region near some base point around which the linearization is made. Some non linear equations are as follows;

15
A linearized model can be developed by approximating each non linear term with its linear approximation. A non linear term can be approximated by a Taylor series expansion to the nth order about a point if derivatives up to nth order exist at the point.

16
The Taylor series for a function of one variable about xs is given as,
xs is the steady-state value. x-xs=x’ is the deviation variable. The linearization of function consists of only the first two terms;

17
Examples:

18
Example: Consider CSTR example with a second order reaction.
Mathematical modelling for the tank gives; The non linear term can be linearized as; The linearized model equation is obtained as;

19
Example: Considering a liquid storage tank with non linear relation for valve in output flow rate from the system;

Similar presentations


 relates one input and one output: The following terminology.>")


 relates one input and one output: The following terminology.>")


 2. Converts mathematics to algebraic operations 3. Advantageous.>")
