Download presentation
Presentation is loading. Please wait.

1
Localized Aviation MOS Program (LAMP) Judy E. Ghirardelli National Weather Service Meteorological Development Laboratory February 05, 2009

2
Outline LAMP Background LAMP Verification LAMP Products Current Status and Future Plans

3
LAMP Background

4
Localized Aviation MOS Program (LAMP) Background LAMP is a system of objective analyses, simple models, regression equations, and related thresholds which together provide guidance for sensible weather forecasts LAMP acts as an update to GFS MOS guidance Guidance is both probabilistic and non-probabilistic LAMP provides guidance for aviation elements LAMP bridges the gap between the observations and the MOS forecast
 Background LAMP is a system of objective analyses, simple models, regression equations, and related thresholds which together provide guidance for sensible weather forecasts LAMP acts as an update to GFS MOS guidance Guidance is both probabilistic and non-probabilistic LAMP provides guidance for aviation elements LAMP bridges the gap between the observations and the MOS forecast")
5
Theoretical Model Forecast Performance of LAMP, MOS, and Persistence LAMP outperforms persistence for all projections and outperforms MOS in the 1-12 hour projections. The skill level of LAMP forecasts begin to converge to the MOS skill level after the 12 hour projection and become almost indistinguishable by the 20 hour projection. The decreased predictive value of the observations at the later projections causes the LAMP skill level to diminish and converge to the skill level of MOS forecasts.

6
LAMP Guidance Details LAMP provides station-oriented guidance for: –all LAMP forecast elements –~1600 stations –CONUS, Alaska, Hawaii, Puerto Rico LAMP provides grid-oriented guidance for: –Thunderstorms: Probability of thunderstorm occurrence in a 2 hour period in a 20-km grid box Best Category Yes/No of thunderstorm occurrence in a 2 hour period in a 20- km grid box –CONUS only As of November 13, 2008, LAMP is running 24 times a day (every hour) in NWS operations Temperature and dewpoint Wind speed, direction, and gusts Probability of precipitation (on hr) Probability of measurable precipitation (6- and 12-h) Precipitation type Precipitation characteristics Thunderstorms Ceiling height Conditional ceiling height Total sky cover Visibility Conditional visibility Obstruction to vision LAMP guidance is in the range of 1- 25 hours in 1 hour projections
 in NWS operations Temperature and dewpoint Wind speed, direction, and gusts Probability of precipitation (on hr) Probability of measurable precipitation (6- and 12-h) Precipitation type Precipitation characteristics Thunderstorms Ceiling height Conditional ceiling height Total sky cover Visibility Conditional visibility Obstruction to vision LAMP guidance is in the range of hours in 1 hour projections")
7
Points/Grid for which LAMP generates forecasts LAMP stationsLAMP thunderstorm grid points

8
Example of a LAMP Text Bulletin KBUF BUFFALO GFS LAMP GUIDANCE 2/19/2008 1200 UTC UTC 13 14 15 16 17 18 19 20 21 22 23 00 01 02 03 04 05 06 07 08 09 10 11 12 13 TMP 21 22 21 22 22 22 22 22 22 22 21 21 20 20 20 20 20 19 19 18 17 16 16 15 16 DPT 12 12 12 12 12 12 12 13 12 12 12 12 13 13 13 13 13 12 12 11 11 11 10 10 9 WDR 25 25 25 25 25 25 24 24 24 25 25 25 25 25 25 24 24 25 25 25 25 25 25 25 25 WSP 20 18 19 18 19 18 19 19 20 19 18 17 15 13 12 12 11 10 09 09 09 08 08 08 08 WGS 27 26 26 25 26 26 26 27 27 26 25 24 21 NG NG NG NG NG NG NG NG NG NG NG NG PPO 74 69 72 63 64 59 68 74 74 67 60 55 50 51 48 49 49 49 48 47 46 48 48 48 50 PCO Y Y Y Y Y Y Y Y Y Y Y Y Y Y Y Y Y Y Y Y Y Y Y Y Y P06 40 35 36 27 TP2 0 0 0 0 0 0 0 0 0 0 0 0 0 0 TC2 N N N N N N N N N N N N N N POZ 0 0 0 0 0 0 0 0 0 1 1 0 0 1 0 0 0 0 1 1 1 1 1 1 1 POS 99 99 99100100100100100100100100100100 99100100100100 99 99 99 99 99 99 99 TYP S S S S S S S S S S S S S S S S S S S S S S S S S CLD OV OV OV OV OV OV OV OV OV OV OV OV OV OV OV OV OV OV OV OV OV OV OV OV OV CIG 6 6 6 5 5 5 5 5 5 5 5 6 6 6 6 6 6 6 6 6 6 6 6 6 6 CCG 5 5 5 5 5 4 4 4 4 4 5 6 6 6 6 6 6 6 6 6 6 6 6 6 6 VIS 7 7 7 7 7 7 6 5 5 6 7 7 7 7 7 7 7 7 7 7 7 7 7 7 7 CVS 6 5 5 5 5 5 5 5 3 5 5 5 5 5 5 5 5 5 5 5 5 5 5 5 4 OBV N N N N N N N N N N N N N N N N N N N N N N N N N Temperature Dewpoint Wind Direction Wind Speed Wind Gust Probability of Precipitation Occurrence on the hour Yes/No Precipitation Occurrence on the hour Probability of 6-Hour Measurable Precipitation Probability of Snow Probability of Freezing Precipitation Type Total Sky Cover Ceiling Height Conditional Ceiling Height Visibility Conditional Visibility Obstruction to Vision Probability of Thunderstorms during 2-Hour period Yes/No Thunderstorm Occurrence during 2-Hour period

9
Example of blending Observations and MOS

10
1-3 hr LAMP Thunderstorm forecast Predictor: lightning strike data Predictor: MOS Thunderstorm Prob LAMP Thunderstorm Probability

11
11-13 hr LAMP Thunderstorm forecast Predictor: MOS Thunderstorm Probability LAMP Thunderstorm Probability

12
June 8, 2007 GMOS 03h forecast Available ~16:45 UTC Valid 18-21 UTC

13
June 8, 2007 1500 UTC LAMP forecast LAMP 02h forecast Available ~15:45 UTC Valid 17-19 UTC Verifying Lightning Strikes

14
June 8, 2007 1800 UTC LAMP forecast LAMP 02h forecast Available ~18:45 UTC Valid 19-21 UTC Verifying Lightning Strikes

15
LAMP Verification

16
0900 UTC LAMP compared to MOS Categorical Ceiling Height < 1000 feet 0900 UTC LAMP verified against 0000 UTC GFS MOS

17
0900 UTC LAMP compared to MOS Categorical Visibility < 3 miles

18
LAMP compared to WRF-NMM and RUC20 Categorical Ceiling Height < 1000 feet

19
LAMP compared to WRF-NMM and RUC20 Categorical Visibility < 3 miles

20
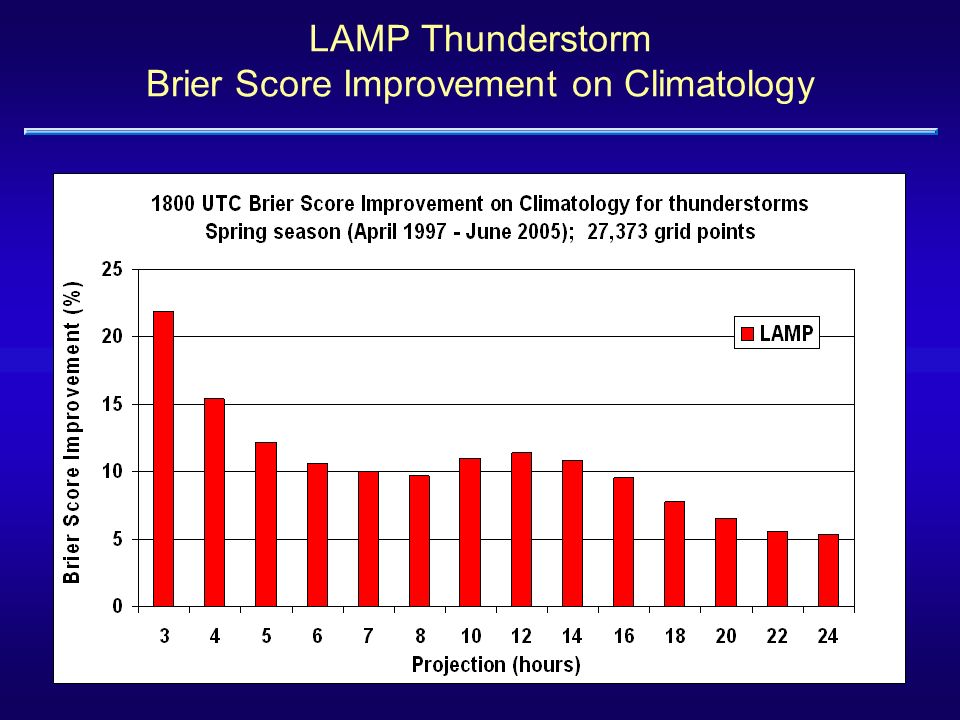
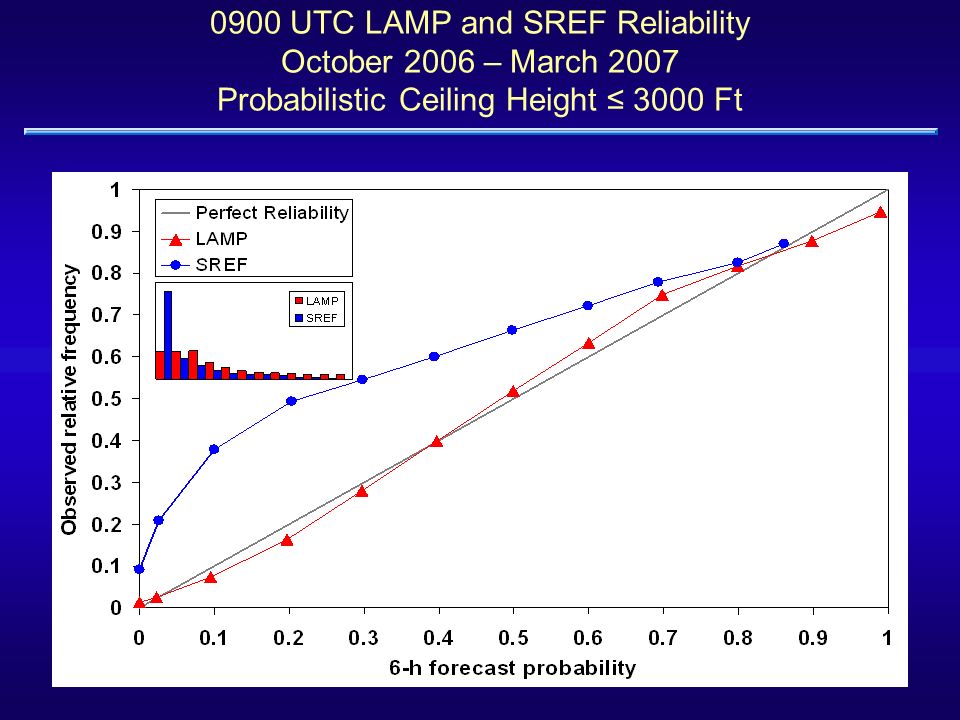
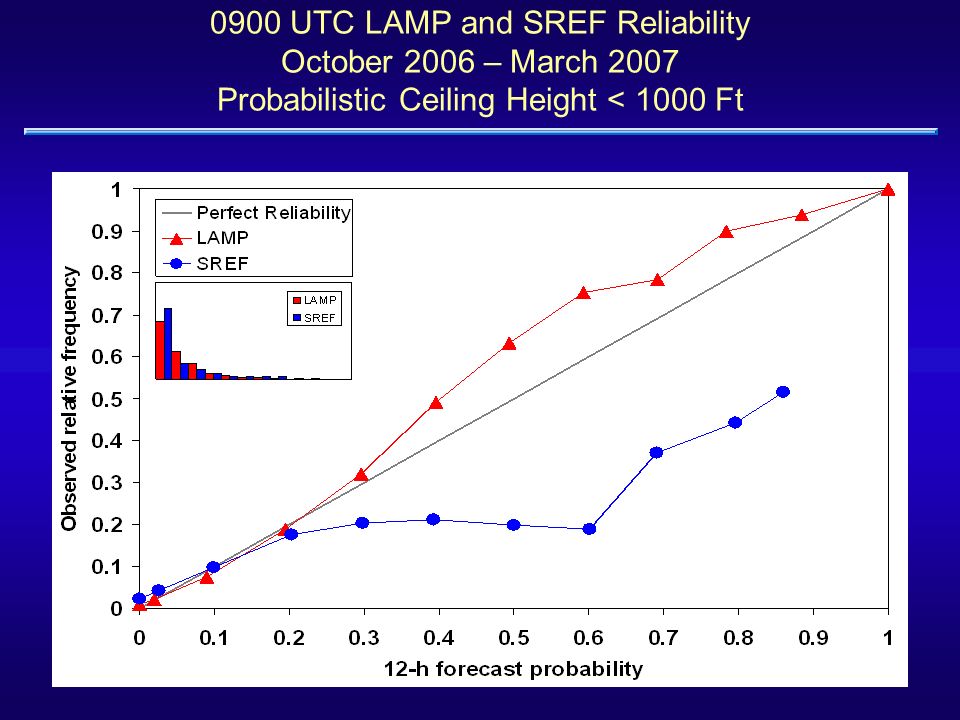
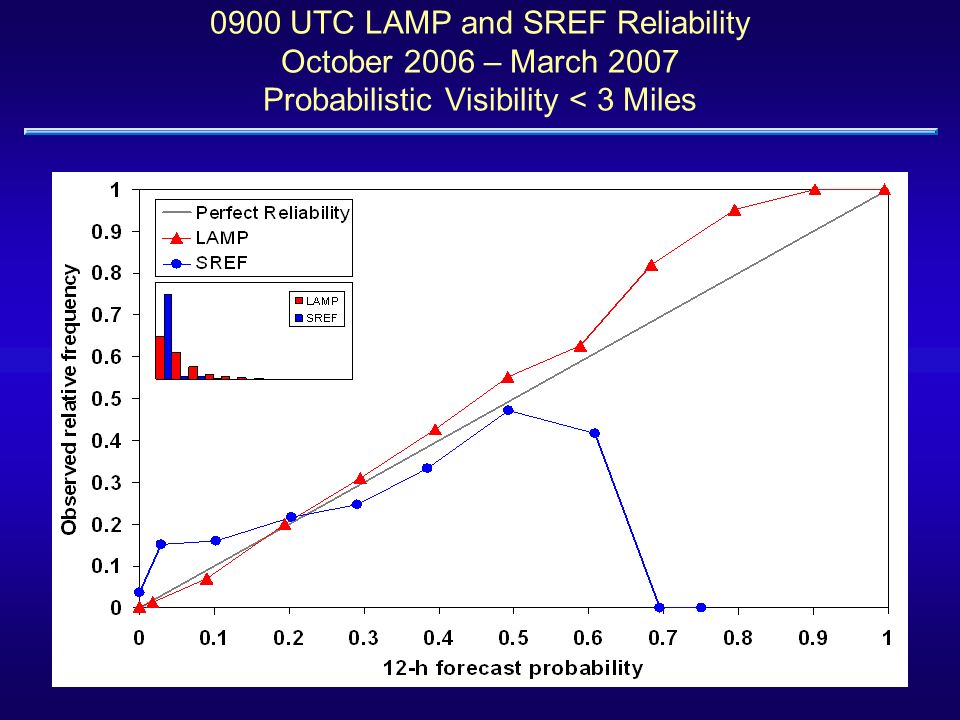
Probabilistic Verification Basic measure of accuracy is Brier score (lower is better). Measure of skill is the improvement in Brier score over a benchmark standard, such as climatology. The reliability of probability forecasts describes the degree to which the forecast relative frequency of the weather event has an overforecasting or underforecasting bias.

21
LAMP Thunderstorm Brier Score Improvement on Climatology

23
0900 UTC LAMP and SREF Reliability October 2006 – March 2007 Probabilistic Ceiling Height ≤ 3000 Ft

26
0900 UTC LAMP and SREF Reliability October 2006 – March 2007 Probabilistic Ceiling Height < 1000 Ft

29
0900 UTC LAMP and SREF Reliability October 2006 – March 2007 Probabilistic Visibility < 3 Miles

32
Current Results LAMP in Stats on Demand:

33
LAMP Products

34
Overview of Available Products Sent out from NCEP on SBN/NOAAPort and NWS FTP Server –ASCII text bulletin –BUFR data –GRIB2 thunderstorm data

35
Overview of Available Products Available to NWS forecasters via AWIPS –Guidance is viewed as text or graphically by forecasters –Guidance is input into software for preparing TAFs

36
Overview of Available Products LAMP Website: http://www.nws.noaa.gov/mdl/gfslamp/gfslamp.shtml

37
LAMP Thunderstorm: Probabilities and Best Category (Y/N) All Projections
 All Projections")
38
LAMP Station Plots Elements Flight Category Click an element name on this slide to see its plot Ceiling Height Total Sky Cover Precipitation Type Obstruction to Vision Visibility Wind Speed Probability of Precipitation Wind Gust Temperature Dewpoint Wind Direction

39
LAMP Station Meteograms Up to 12 displayable LAMP forecast elements Real-time verification of current and past cycles Verification of completed past cycles including the corresponding GFS MOS forecast Features

40
Current Status and Future Plans

41
LAMP FY08-FY09 Accomplishments Implementation: Jan. 15, 2008: NGM LAMP discontinued Apr. 08, 2008: 4 new LAMP cycles added to NWS operations (bringing total to 16 cycles) Jun. 24, 2008: 4 new LAMP cycles added to NWS operations (bringing total to 20 cycles) Nov. 12, 2008: 4 new LAMP cycles added to NWS operations LAMP providing guidance hourly
 Jun. 24, 2008: 4 new LAMP cycles added to NWS operations (bringing total to 20 cycles) Nov. 12, 2008: 4 new LAMP cycles added to NWS operations LAMP providing guidance hourly.")
42
Depicting Probabilistic Information Purpose: indicate to user the uncertainty associated with the Best Category forecasts given the probabilistic information Threshold = dashed black line Probability < thres = green line Probability ≥ thres = red line San Francisco – very small chance of precip St. Louis – slight chance of precip Chicago – slight chance yes and slight chance no precip St. Cloud – high chance of precip

43
Current Work New LAMP probability/threshold graphic to be available on LAMP website soon: Color coded graphic indicates the confidence in choosing a category by indicating how close the probability was to the threshold. One would have more confidence in a chosen category if the probability exceeded the threshold by a large amount, compared to the probability just barely exceeding the threshold. Aviation probabilities and associated thresholds easily viewable for all LAMP stations and cycles

44
Current Work New LAMP probability/threshold graphic to be available on LAMP website starting week of Feb. 2, 2009: Available for selected categories for: Ceiling height Conditional ceiling height Visibility Conditional visibility Probability of precipitation occurring on the hour Conditional probability of freezing, and (freezing or snow)
.")
45
Red=Yes Probability exceeds threshold by more than 10% Orange=Likely Probability exceeds threshold but NOT by more than 10% Yellow = Chance Probability is less than threshold but within 10% Cyan = No Probability is less than threshold by more than 10% LAMP Probabilities and Thresholds for Flight Categories Uncertainty Plot Tab – looking at vis ≤ 5 miles Note that this shows you one condition (e.g., vis ≤ 5 miles). To determine the most likely condition, you should consider the rarest conditions first.

46
Current Work Other work: Representing LAMP at Regional Aviation Workshops Charleston, WV and Upton, NY FY08 Columbia, SC and Cleveland, OH FY09 Working with FAA on using LAMP thunderstorms for Traffic Flow Management

47
Future Plans Gridded LAMP forecasts of: Temperature and dewpoint Wind speed Probabilities of Ceiling Height Ceiling Height Probabilities of Visibility Visibility

48
Future Plans: FY09 * OSIP for Gridded LAMP Minimize inter-element inconsistencies in anticipation of gridding forecasts Prototype of Gridded LAMP running routinely on NCEP computers, but not disseminated Redevelop LAMP station guidance of ceiling height and opaque sky cover Monthly TAF reports * Contingent on FY09 funding

49
Future Plans: FY10-12 Implement Gridded LAMP into NWS Operations Inter-hour station-based LAMP using SPECI observations Gridded analysis of aviation observations for use as verification of LAMP grids. Verification of gridded LAMP using LAMP’s gridded observations Other elements? (maybe convective cloud tops)
.")
50
Questions? LAMP Website: –http://www.nws.noaa.gov/mdl/gfslamp/gfslamp.shtml Contact: –Judy.Ghirardelli@noaa.gov

Similar presentations


 Version 1.0 January 2013.>")


 Full range of products available at:>")


 Guidance by Using Emerging Forecast and Observation Systems Judy E. Ghirardelli, Jerome P. Charba,>")

 is responsible for forecasts several times.>")

: Improvements to convective forecasts in response to user feedback Judy E. Ghirardelli National.>")
