Download presentation
Presentation is loading. Please wait.

1
Interpreting Position vs. Time Graphs Mr. Rana 9/20/12

2
Bell Ringer (on loose leaf paper with name, date, period) Graph the following points: (0,0) (0,1) (1,1) (1,2) (1,3) and (2,3) Now connect them with a line. You must be in your assigned seat to be marked present.

3
Displacement Δx = displacement x f = final position x i = initial position

4
Position vs. Time Graphs

5
Construct a position vs. time graph for the following data:

7
At t = 0, you are at position _______. At t = 2, you are at position _______. At t = 3 you are at position _______.

8
How can we get a horizontal line? If we don’t move at all, the position vs. time graph will be a horizontal line.

9
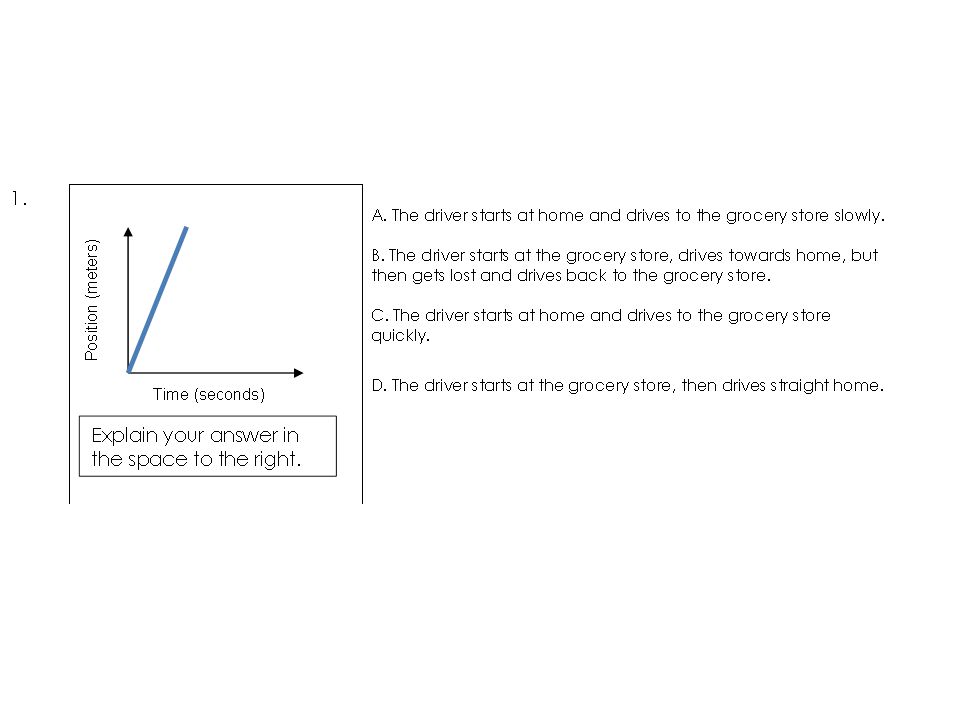
How can we get a line with positive slope? If we leave the origin and keep moving, we get a positive slope (upward).
..")
10
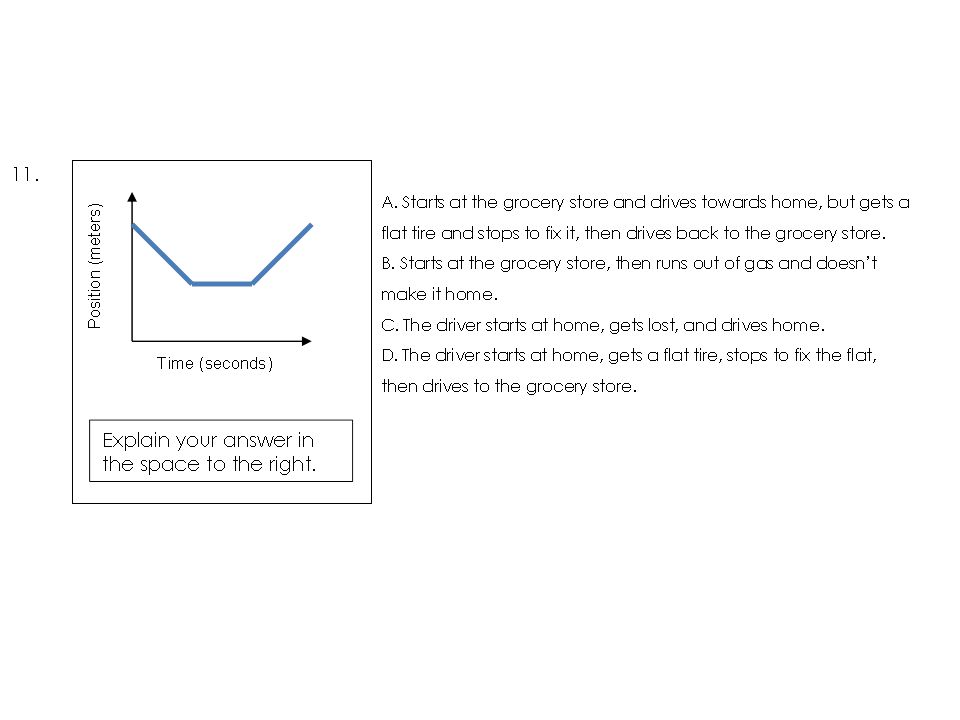
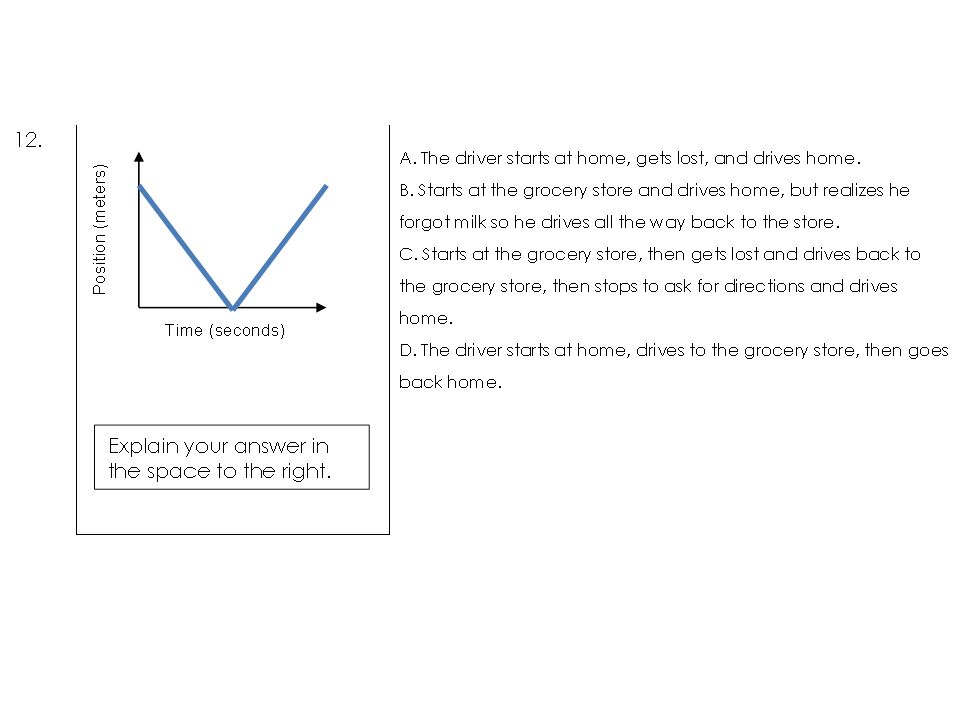
How can we get a line with negative slope? If we go toward the origin and keep moving, we get a negative slope (downward).
..")
Similar presentations


 ? a. y = 3x - 6 b.>")


 time(s) Describe the motion of the object represented by this graph This object is at rest 2m.>")


