Download presentation
Presentation is loading. Please wait.

1
PAGE 1 An adaptation of SMOKE for Europe Johannes Bieser Armin Aulinger, Volker Matthias, Markus Quante GKSS Research Center Geesthacht, Germany

2
PAGE 2 Outline Introduction Data used for European emission modelling Changes to the SMOKE model CMAQ performance using SMOKE emissions Conclusions

3
PAGE 3 Introduction Consistency Consistent data for all of Europe Consistent emissions for long-term CTM runs Flexibility Other species, chemical mechanisms, etc... Emission scenarios Model domain, year

4
PAGE 4 SMOKE for Europe Introduction Emission Inventories Surrogates Temporal profiles Stack information Meteorology Speciation profiles Pre-processors SMOKE Additional modules Model ready emissions

5
The bulk emission inventory EMEP official national annual emissions EPER Major point sources Species included: CO, NOx, NH3, SOx, PM10, PM2.5, NMVOC

6
Gridded Population of the World v.3 Resolution: 1 x 1 km Data available for: 1990 1995 2000 2005 2010 2015

7
CORINAIR LAND COVER 100 x 100 m 1990,2000,2006

8
USGS Global Landcover

9
Official European statistics: - Spatial resolution: NUTS2 - Employment rates for different industrial sectors - Employment rates in agriculture - Net working times - Animal stocks EUROSTAT

10
OPENSTREETMAPS.ORG

11
Digital Chart of the World Road and Rail Network 1992 Germany Western Russia

12
UBA Forest database Forest cover database 120 different tree types used as input for BEIS 3.14 Resolution: 1 x 1 km

13
PAGE 13 New SMOKE modules - SMOKE for Europe introduces two new modules (blue) which affect the temporal and spatial disaggregation of the emissions. - NORMAT reads meteorological datafor one whole year and creates a normalization matrix. - MODMAT changes the gridding matrix for each day depending on meteorological data.

14
Influence of the MODMAT module

15
SMOKE modelling domain used for evaluation - 54x54km² grid over Europe - 30 vertical layers up to 100 hPa - Scenario year: 2000 - CTM: CMAQ 4.6 - chemical mechanism: CB IV - meteorology: CCLM - BC: TM4

16
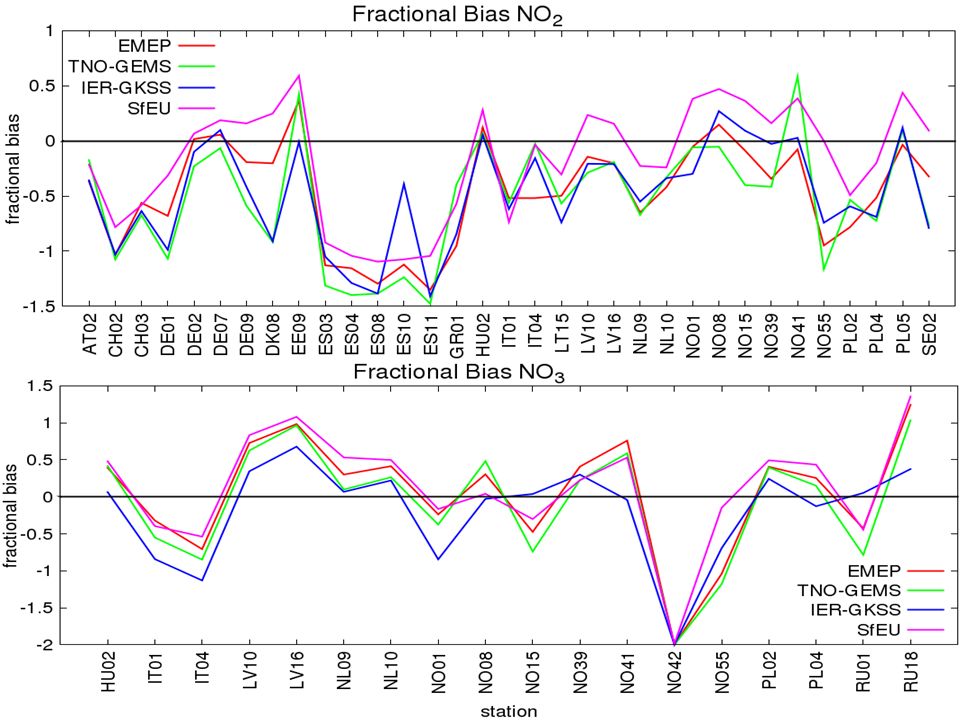
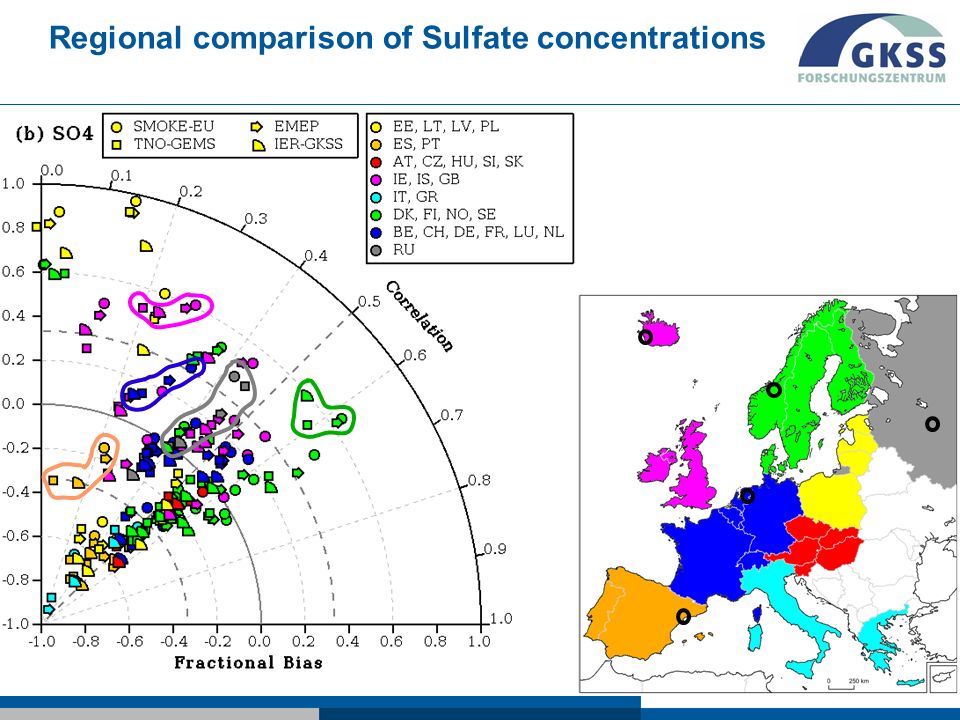
Emission model used for comparison EMEPIER-GKSS TNO-GEMSSMOKE-EU

19
Regional comparison of Sulfate concentrations

21
Regional comparison of Ozone concentrations

22
Conclutions - The SMOKE model has been adapted to create European emissions for long-term CTM runs (1979-2010). - A new module has been introduced which allows to directly couple meteorological fields with the spatial and temporal disaggregation of area sources. - SMOKE-EU emissions were evaluated by comparison with emission datasets from three widely used European emission models. - CMAQ runs for the year 2000 using the different emission datasets created comparable results.

Similar presentations


pyrene concentrations and depositions in Europe Volker Matthias, GKSS.>")