Download presentation
Presentation is loading. Please wait.

1
Impact of Climate Change in the Non- Glacial Fed Himalayan River System: A Case Study From the Kosi River in District Almora, Uttarakhand State (India) J.S.Rawat Director Centre of Excellence for Natural Resources Data Management System in Uttarakhand Professor & Head Department of Geography Kumaun University, SSJ Campus Almora-263601 Uttarakhand (India) jsrawat1955@gmail.com
 J.S.Rawat Director Centre of Excellence for Natural Resources Data Management System in Uttarakhand Professor & Head Department of Geography Kumaun University, SSJ Campus Almora Uttarakhand (India)")
5
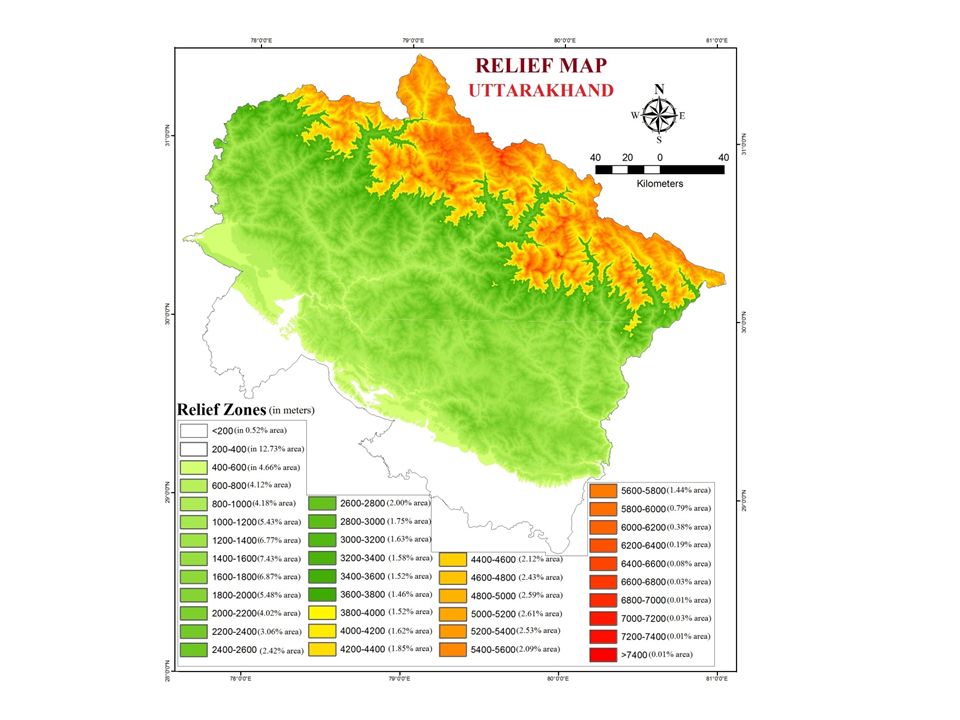
Non-Glacial Watersheds of Uttarakhand

6
IMPRINTS OF CLIMATE CHANGE IN UTTARAKHAND 1. Increase in temperature 2. Reduction in snow cover area 3. Steady recession of glaciers 4. Diminishing regulatory effect of glaciers 5. Shifting of vegetation line 6. Development of pro-glacial lakes 7. Increasing trend of drought years 8. Transformation of glacial fed rivers 9. Increase in Annual Rainfall 10. Decrease in winter, summer and post monsoon rains 11. Increase in monsoon rains 12. Reduction in annual rainy days 13. Change in rainfall rhythm

7
IMPRINTS OF CLIMATE CHANGE IN UTTARAKHAND 14. Transformation of perennial streams 15. Diminishing length of perennial streams 16. Dwindling of summer discharge in rivers 17 Phonological changes 18. Reductions in crop production 19. Shifting of apple belt 20. Reduction in production of fruits 21 Impact in pest spectrum 22 Invasion of xerophytes plant roileana 23. Developments of palm tree colonies

8
Experimental Micro Watershed

9
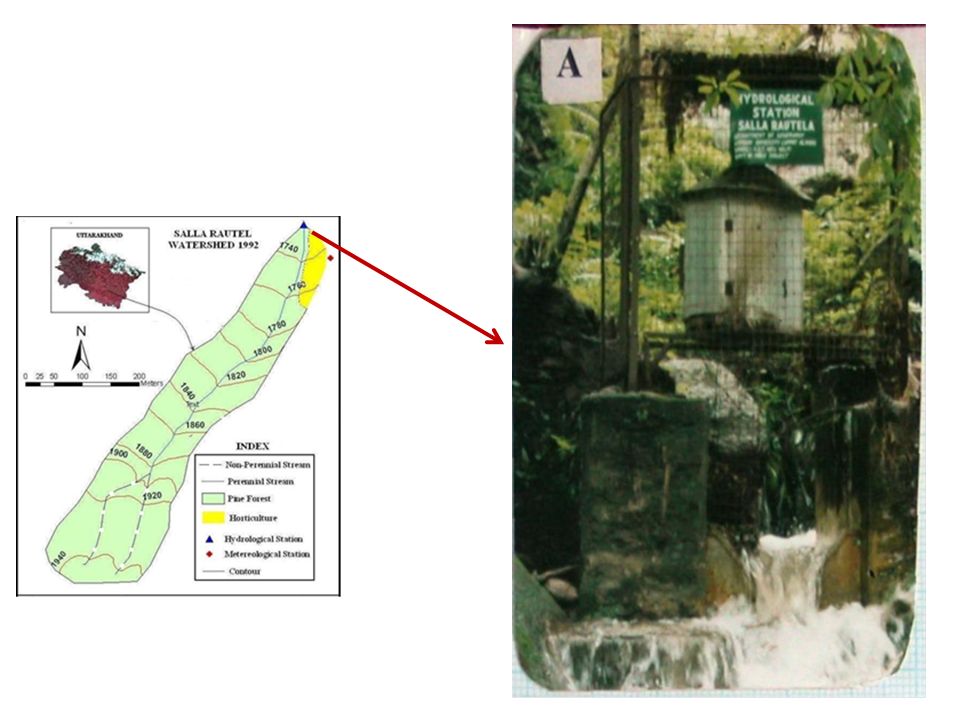
Select Excremental Watershed Salla Rautela Zoom This Watershed with details of 1992

10
Location Map of the Kosi watershed

11
Location Map of the Salla Rautela micro watershed

12
Show Hydrological Records

15
RAINFALL (1992-2013)
")
16
Month MeanSDCVMaximumMinimum January 39.2232.8183.65121.061 February 56.7252.2292.07176.700 March 28.9628.5698.62114.890 April 29.4025.8287.83105.520 May 46.4325.5154.9491.480 June 137.59100.5273.06405.122 July 224.96102.4845.55538.6794 August 231.81107.8046.50506.2559 September 175.24147.0783.92563.980 October 18.3730.29164.85107.140 November 5.9410.11170.2640.800 December 9.5414.50151.9857.180 Winter 105.4968.0864.54243.0012 Summer 104.7952.2049.82222.9332 Monsoon 769.60253.3432.921442.72479 P. Monsoon 24.3136.82151.48134.280 Annual 1004.18266.8226.571595.31585 RAINFALL (1992-2013)
.")
17
HYETOGRAPH/HYDROGRAPH (1992-2013)
")
18
IMPACTS OF CLIMATE CHANGE 9. Increase in Annual Rainfall 10. Increase in Monsoon Rain Rainfall 11. Decrease in winter, summer and post monsoon rains 12. Drastic decrease in rainy days 13. Transformation of perennial stream to non- perennial stream 14. Dwindling of summer discharge 15. Increase in runoff 16. Change in rainfall rhythm

19
ANNUAL RAINFALL:INCREASING TREND Average Annual Rf 1004mm

20
MONSOON RAINFALL:INCREASING TREND

21
WINTER RAINFALL

22
SUMMER RAINFALL

23
POST MONSOON RAINFALL

24
12. Drastic decrease in rainy days

25
Monthwise Rainy Days Years JanFebMarAprilMayJuneJulyAugSeptOctNovDecTotal 1992 765051423 1122098 1993 1281129 141317 00114 1994 8718111525214001101 1995 74433112213 00080 1996 507432117211230093 1997 865131120191211785125 1998 2877661918973092 1999 42107142091640380 2000 6105082218171101098 2001 248511162318000188 2002 11155791092014202104 2003 564541315191602493 2004 610641213211073083 2005 141160710262117501118 2006 209415122318731296 2007 177591117201221496 2008 3348121923188110100 2009 23531861510 41178 2010 240110919241600287 2011 1546111917211100095 2012 402100123252331395 2013 2623181716600162 Avg555581319181231194

26
Rainy Days (Average 94 Days/yr) Month MeanSDCVMaximumMinimum January 53.6971.1314.001 February 53.7871.7315.000 March 52.8962.2811.000 April 53.4676.1313.000 May 84.4656.4018.000 June 135.3241.8022.001 July 194.2822.5926.009 August 184.3624.1225.009 September 125.0043.3323.000 October 33.96129.9617.000 November 11.82167.148.000 December 11.56114.385.000 Winter 126.6956.6528.004 Summer 176.9140.4129.006 Monsoon 618.5413.9374.0041 Post Monsoon 44.79115.8917.000 Annual 9413.8814.71125.0062 (Almora 1955-80 :135 Days/yr)
 Month MeanSDCVMaximumMinimum January February March April May June July August September October November December Winter Summer Monsoon Post Monsoon Annual (Almora :135 Days/yr)")
27
RAINY DAYS TREND :ANNUAL Avg. 94 days/yr Almora 25 km East Almora Avg. 125 days/yr (1955-1980)
")
28
RAINY DAYS TREND :WINTER

29
RAINY DAYS TREND :PRE MONSOON

30
RAINY DAYS :MONSOON

31
RAINY DAYS :POST MONSOON

32
13.Increase in runoff

33
Monthly Discharge l/sec (1992-2013)
")
34
Average Monthly/Seasonal Discharge (1992-2013) Month MeanSDCVMaximumMinimum January 0.500.4181.501.230.00 February 0.790.6177.422.000.00 March 0.420.3992.971.750.00 April 0.490.4490.351.490.00 May 0.580.3356.901.410.00 June 2.795.47196.3027.390.01 July 4.303.9491.7116.881.01 August 4.703.3070.0913.470.79 September 4.574.59100.3420.950.46 October 0.671.01150.314.600.04 November 0.290.62216.032.830.00 December 0.130.17126.980.720.00 Winter 0.480.2553.210.880.05 Summer 0.500.2855.451.010.07 Monsoon 4.092.4860.5610.811.49 Post Monsoon 0.480.70145.062.950.02 Annual 1.690.8248.684.060.65
 Month MeanSDCVMaximumMinimum January February March April May June July August September October November December Winter Summer Monsoon Post Monsoon Annual")
35
Annual Discharge Trend

36
Annual Discharge/Rainy Days/Rainfall Rainy Days

37
WinterDischarge Trend

38
Summer Discharge Trend

39
Monsoon Discharge Trend

40
Post Monsoon Discharge Trend

41
14. Change in Rainfall Rhythm

42
Change in Rainfall Rhythm Annual Hyetograph ( Peak July)
")
43
Annual Hyetograph (Peak August)
")
44
Annual Hyetograph (Peak September )
")
45
15.Transformation of Perennial Streams to Non- Perennial Streams

46
Salla Rautela River Perennial in 1992

47
Salla Rautela Intermittent Stream in 2001

48
Salla Rautela Seasonal Stream in 2013

49
Show Hydrographic Maps of 1992 and 2002

50
NON-GLACIAL FED RIVER RESIGM 15.Transformation of Perennial Streams to Non- Perennial Streams

51
Month Mea nSDCV Maximu m Minimu m January 56.08128.6219.000 February 66.44113.3320.000 March 76.9397.7923.000 April 1311.2489.5727.000 May 1412.0484.9130.000 June 47.07176.7820.000 July 00.00 0 August 00.00 0 September 00.00 0 October 66.20108.2018.000 November 97.7590.2121.000 December 108.8287.8422.000 Winter 2018.8892.2957.000 Summer 3429.8688.3080.000 Monsoon 47.07176.7820.000 Post Monsoon 1413.360.0039.000 Annual 7364.240.00168.000 No Discharge Days (1992-2013)
")
52
ANNUAL: NO DISCHARGE DAYS Avg.73 days/yr

53
WINTER: NO DISCHARGE DAYS

54
PRE MONSOON: NO DISCHARGE DAYS

55
MONSOON: NO DISCHARGE DAYS

56
POST MONSOON: NO DISCHARGE DAYS

57
16. Decrease in stream length

58
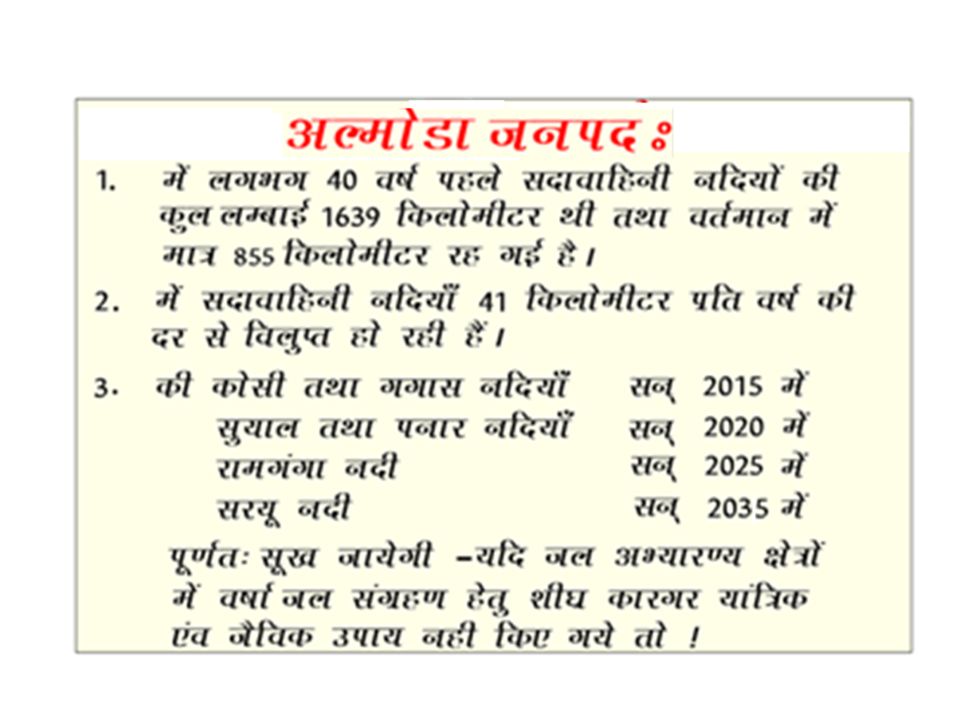
Perennial rivers network (in green colour) in the Kosi Watershed: about 50 years back the total length of perennial streams in the Kosi watershed was about 225.85km (A); and at present the length of perennial stream in the Kosi watershed is only 41.9km.
 in the Kosi Watershed: about 50 years back the total length of perennial streams in the Kosi watershed was about km (A); and at present the length of perennial stream in the Kosi watershed is only 41.9km.")
59
NON-GLACIAL FED RIVER RESIGM 16. Dwindilling of base flow

60
NON-GLACIAL FED RIVER RESIGM 16. Dwindilling of base flow

61
Minimum annual water discharge of Kosi River at Kosi.

62
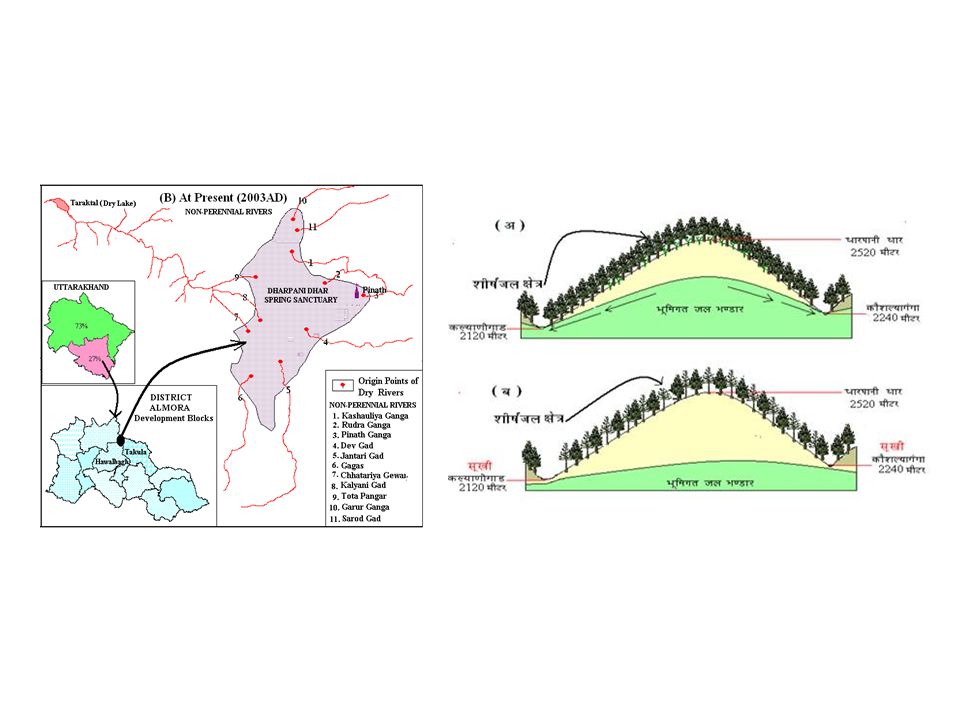
Select Dharpanidhar Spring Sanctuary Zoom This Area

63
Bhatkot Reserved Forest Open Present Condition

64
Bhatkot Reserved Forest

65
Transformation of Perennial Streams into Non-Perennial Streams

67
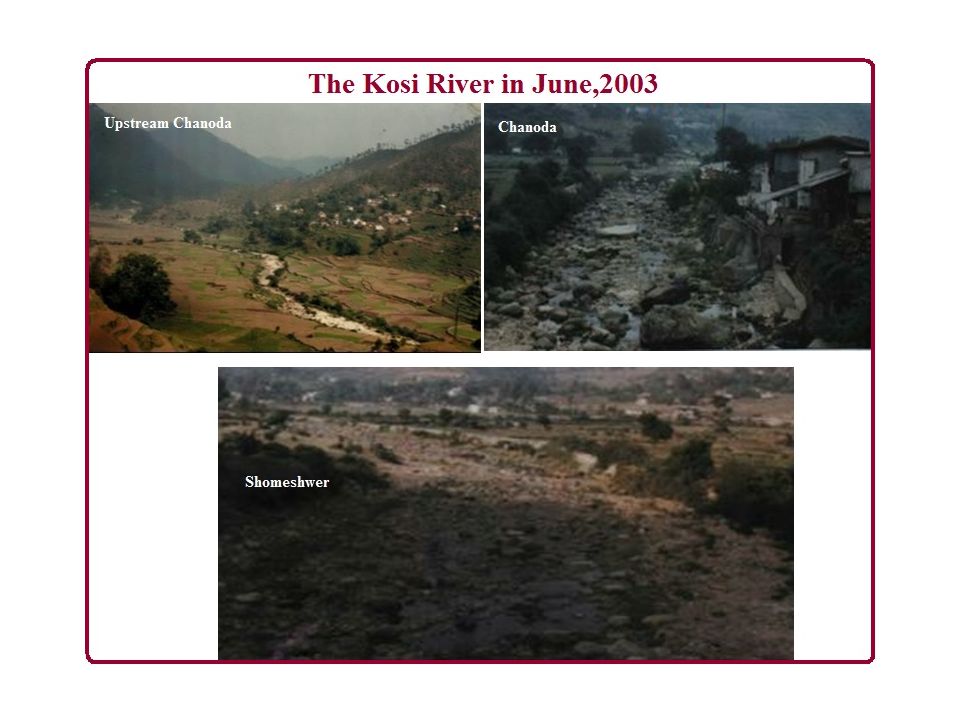
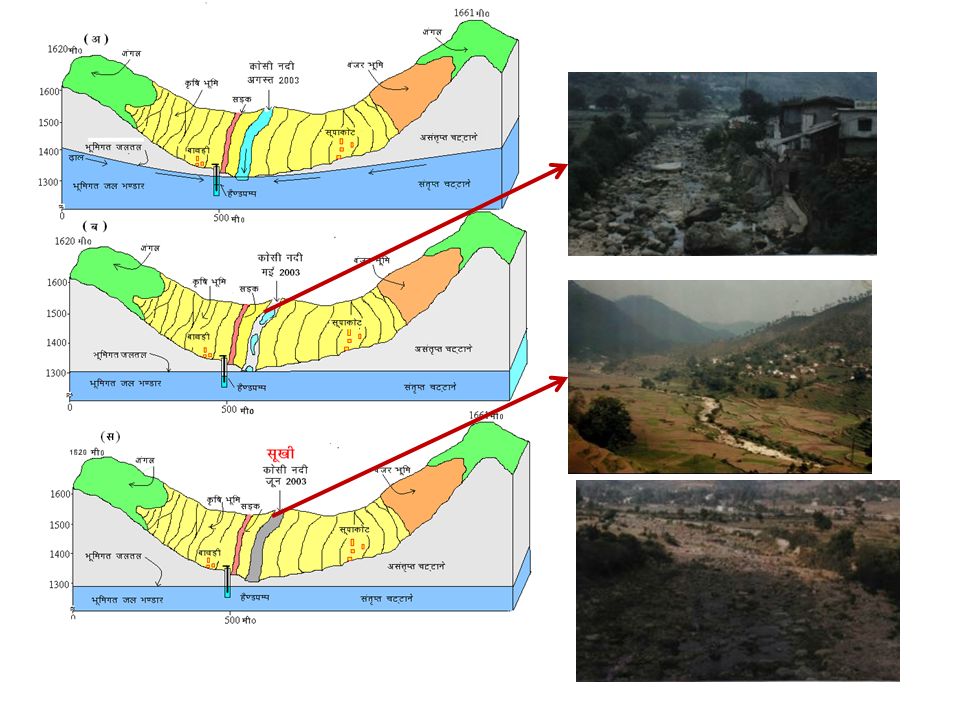
KOSI RIVER Completely Dead on Source Region

69
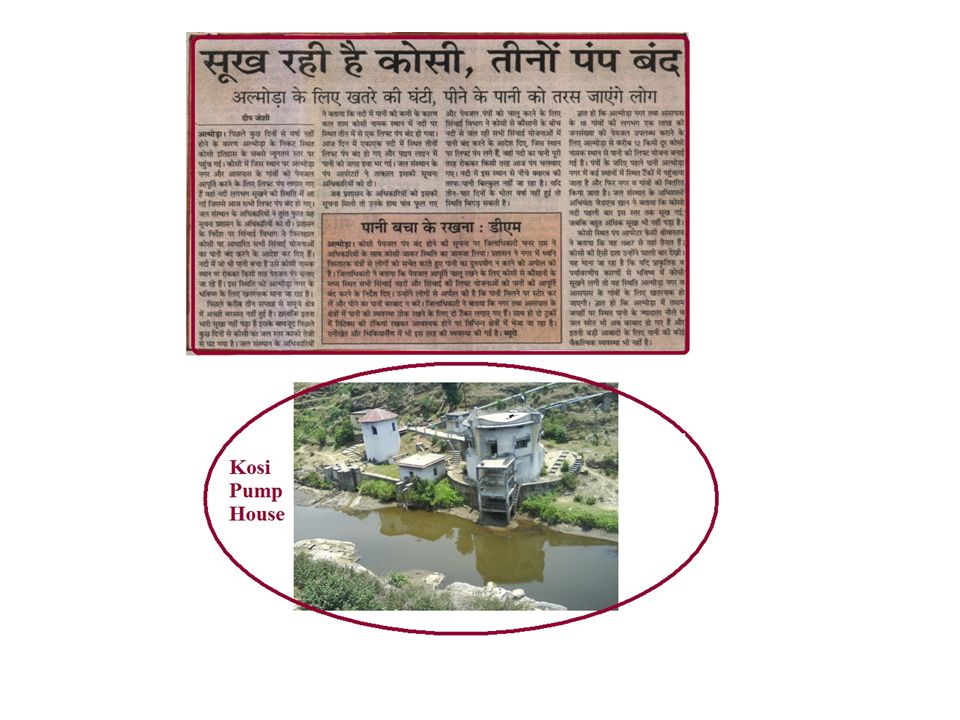
Drinking Water Pump House at Kosi River for Almora Town

70
Almora Pump House, 22 JUNE 2009

72
List of Dry Perennial Streams of District Almora River SystemDry Perennial Stream 14 Kosi RiverNani Kosi, Raingad, Janelgad, Bengad, Khasrotragad, Sumarigad, Sai Nala, Devgad, Manolgad, Simgad, Naraiyegad, Ghatgad, Jaurasi Nala, Kutchgad, Jamtharagad- 14

75
THANK YOU

Similar presentations