Download presentation
Presentation is loading. Please wait.

1
Graphing

2
Data Tables are a neat and organized way to collect data Graphs allow you to easily show the data in a way that people can draw conclusions easily. There are several types of graphs: –Pie charts: These show data in terms of a percentage –Line graphs: These show data over time –Bar graphs: These compare one group of data to another Statistics are mathematical tests that can tell us useful things about data –Example: the mean, median, mode –Standard Deviation: the mean of the mean

3
How to calculate average Average: add up all the numbers from a column and divide by how many numbers there are

4
How to make a bar graph Bar graphs compare groups of different items.

6
How to make a bar graph

7
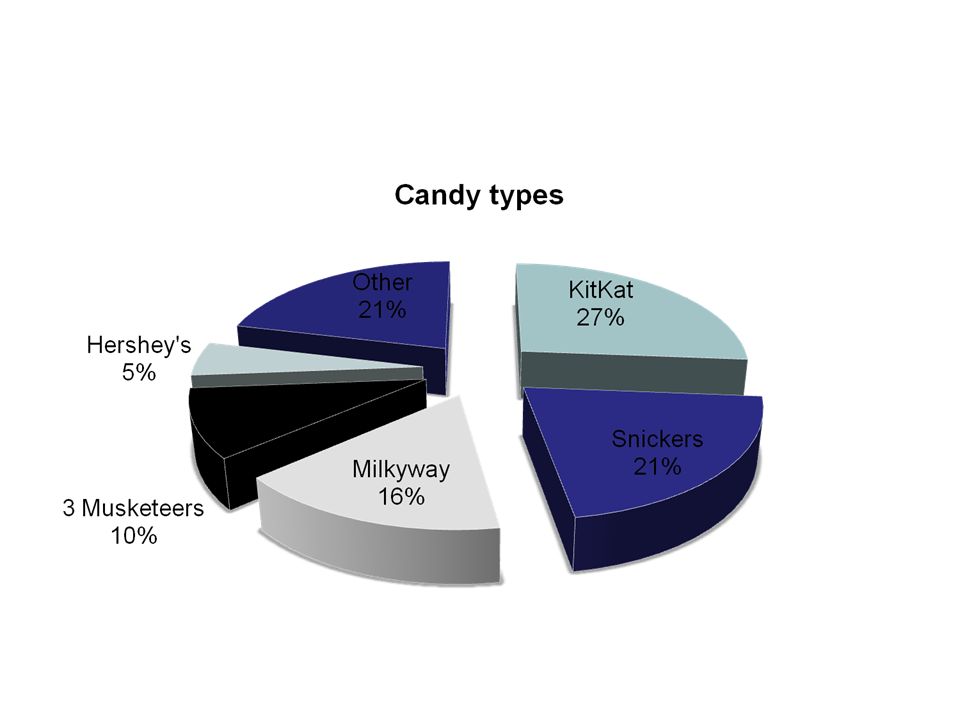
How to make a pie chart Pie charts are graphs showing PARTS of a WHOLE. –Ex. 36 Hershey’s were collected. 120 total candies were collected. Hershey’s are 36/120

9
How to make a pie graph

10
You and your friends visit various houses to collect candy. The amount of candy you collected at each time is shown in the table below. Make a line graph showing the candy you collected that evening. Which time is it best to go out collecting candy? TimeCandy 756 8107 932 106

11
How to make a line graph

Similar presentations


. 1) Add all the individual pieces of data together to get a whole. For example, if you were doing a pie chart on religion on.>")


 Collect, organise and interpret univariate numerical data in order to determine measures of dispersion,>")
 Making Charts or Graphs(bar graphs,circle.>")


 Label it. When would you use a line.>")

